|
Insert Chart |


|
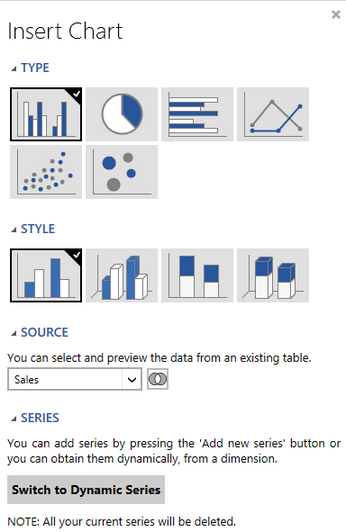
To create a new chart in Ecrion BI Architect, you will need to begin by selecting Insert in the Side Menu. Then, find and expand the Visualization group and select Chart. You will now find yourself working in the Insert Chart dialog where you can select from a variety of powerful charting options. This section of the help documentation focuses on teaching you how to insert and configure any of the various charts that are available to include in your dashboard.
Inserting a Chart Widget - You can view this helpful video on how to insert and configure a sample chart widget, as well as how to edit the chart using the Properties Pane. For information regarding a specific type of chart, please visit the links provided below.
Ecrion BI Architect supports the following types of charts. Below, select the chart type you would like to insert to learn more about including in your dashboard.
For charts of type column, scatter, bubble, horizontal bar, and line, you will have the option to configure as a Dynamic Series Chart. Once inserted, an existing chart can be modified by going to Properties in the Side Menu or in the Ribbon.

Figure 1: Available chart types as seen in the Insert Chart Dialog, in touch mode.