|
Chart Properties |


|
The Chart Properties pane is used for customizing a Chart Widget after inserting into your dashboard. Using the Properties Pane will allow you to make modifications to visual components of your chart widget or edit your chart widget data source.
Access
To learn how to access the Properties Pane, please view the helpful Working with the Properties Pane page for the specific display mode you are using, Mouse or Touch.
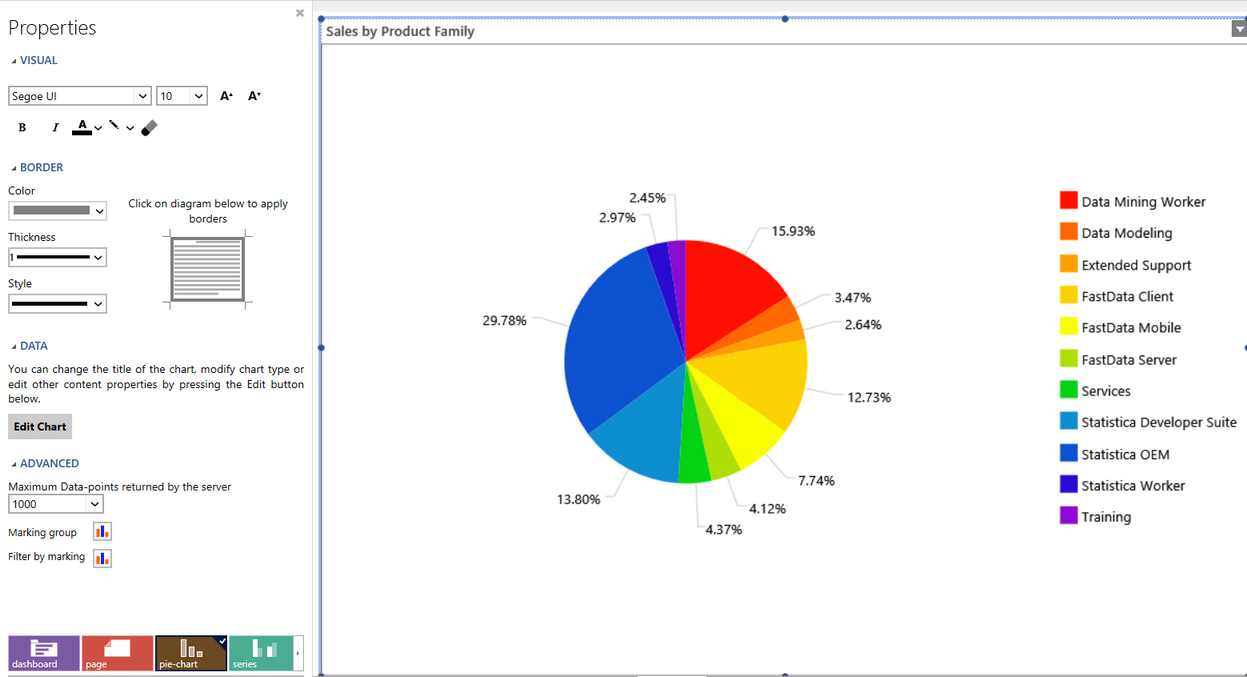
The example in Figure 1 demonstrates the usage of the Properties Pane to make modifications to a pie chart.

Figure 1: The Properties Pane for a pie chart with the target object set to "pie-chart".
The Ecrion BI Architect will allow you to change many properties to modify or improve your chart widgets. At the bottom of the Properties dialog, you must first select the Target Element that you wish to change in the Navigation Bar:
|
|
Figure 2: Pie-chart selected as target element in navigation bar. |
Figure 3: Legend is selected as target element in navigation bar. |
The properties that are displayed for modification in the dialog will be dependent on your selection.
Figure 2 demonstrates the selection of the pie-chart element in the Navigation Bar. Notice that beyond making visual modifications, you can also access your data configuration for the chart widget.
Figure 3 demonstrates the selection of the legend element in the Navigation Bar. Notice that the choices for properties modifications is different. Modifications made here will be applicable only to the legend.
The Navigation Bar will display elements that will fit in the properties dialog bar window. However, you can scroll to the left or right accordingly to access all elements.
Important Properties:

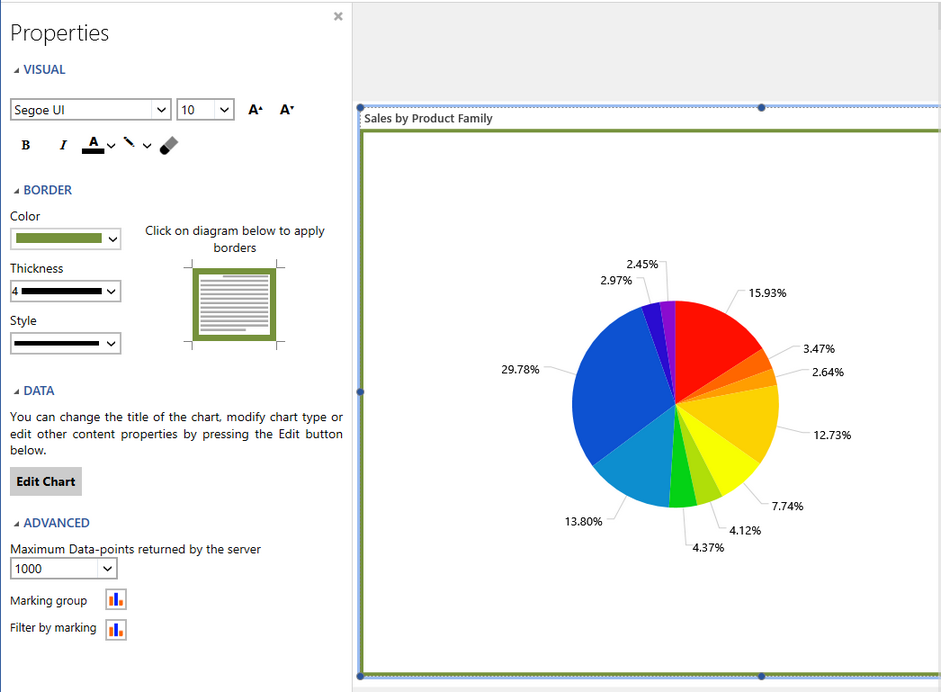
Figure 4: The Properties Pane is used to add a border to the entire chart widget and change the font.
Figure 4 above demonstrates using the Properties Pane to change the entire chart widget font as well as add a green border to the chart widget.
| • | To adjust the font, the Segoe UI font was selected from the list of available fonts. |
| • |
| • | To adjust the borders, the color was selected as green, and then in the border preview image, the external borders were added by clicking appropriately. |
| • |
| • | To make adjustments to your chart legend, select the legend element in the Navigation Bar. Here you can change font options, legend position and alignment, and add borders. |
| • |
| • | To adjust the chart caption, select the caption element in the Navigation Bar. Here you can add borders, adjust fonts, and modify the title of the chart. |
The adjustments made in the Chart Properties will then be displayed in the Design Surface.
Please note for each chart in your dashboard, you can choose to Edit your configured data. For assistance on using this option, please visit Insert Chart.