|
Editing Map Chart Data |


|
As you are working with your Map Chart in your dashboard, you may decided that you would like to edit the configurations of the Map Chart itself.
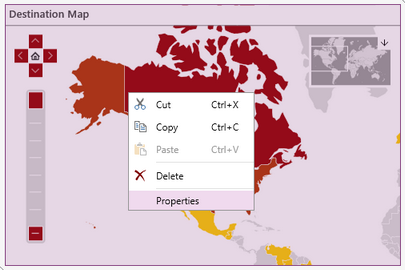
1. Right click on the Map Chart that you want to open the Properties Pane for.
2. From the resulting contextual menu select the Properties option.

Figure 1: The Properties option is highlighted in the contextual menu.
3. Select the Map Chart target object in the Navigation Bar.
![]()
Figure 2: A Map Chart target object is selected.
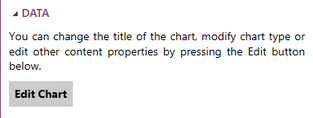
4. Simply select the Edit Chart button in the Properties Pane and you will be taken to the Edit Chart dialog of the selected chart.

Figure 3: The edit Chart button in the Properties Pane.
To learn more about the configuration options for the Map Chart Widget visit Insert a Map Chart.
Next Steps
Show or Hide Small Map - Learn about working with the small map.
Show or Hide Map Zoom - Learn how to work with the Map Zoom.
Caption - Learn how to customize the Map Chart caption to meet your needs.
Widget by Marking - Learn how to use marking to relate your inserted widgets.
Filter by Marking - Learn how to configure your widgets to filter depending on the markings you have set.
Advance Chart Options- Learn about the advance options you can use to customize your chart.
Adding Java Script - Learn how to add javascript to your Charts.