|
Widget Marking |


|
When inserting Widgets and other objects into your dashboards, you are meeting the needs of your users by showing powerful visual representations of the data that is driving each Widget. However, it is important to remember that all of your dashboard objects can be related in some capacity and when your dashboard users interact with one Widget, you may want this to be visually marked in another widget or even filter other widgets in the dashboard to only display the content related to the selected item.
To configure Marking for your inserted widgets you will need to follow the steps below.
1. Navigate to the Properties Pane for your selected widget.
2. Select the Configure button from the Marking section of the Properties Pane.

Figure 1: The configure button in the Marking section of the Properties Pane.
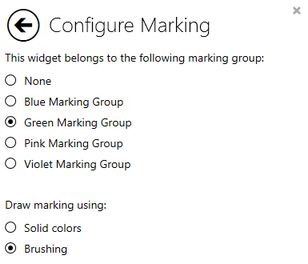
3. Select from one of the 5 marking group options available, Blue, Green, Pink, Violet, or None.

Figure 2: The Green marking group was selected for this widget.
4. If you have selected the widget to be included in one of the 4 colored marking groups, you will now need to select the type of shading you would like the marking to be shown as in your dashboard, either solid colors or bushing.

Figure 3: The shading option Brushing has been selected.
Example
Let's take a closer look at an example to demonstrate marking a bit better. We'll use the AdventureworksCustomers.bid dashboard design sample that comes with the installation of the BI Architect. You can follow along with this pre-configured dashboard to assist.
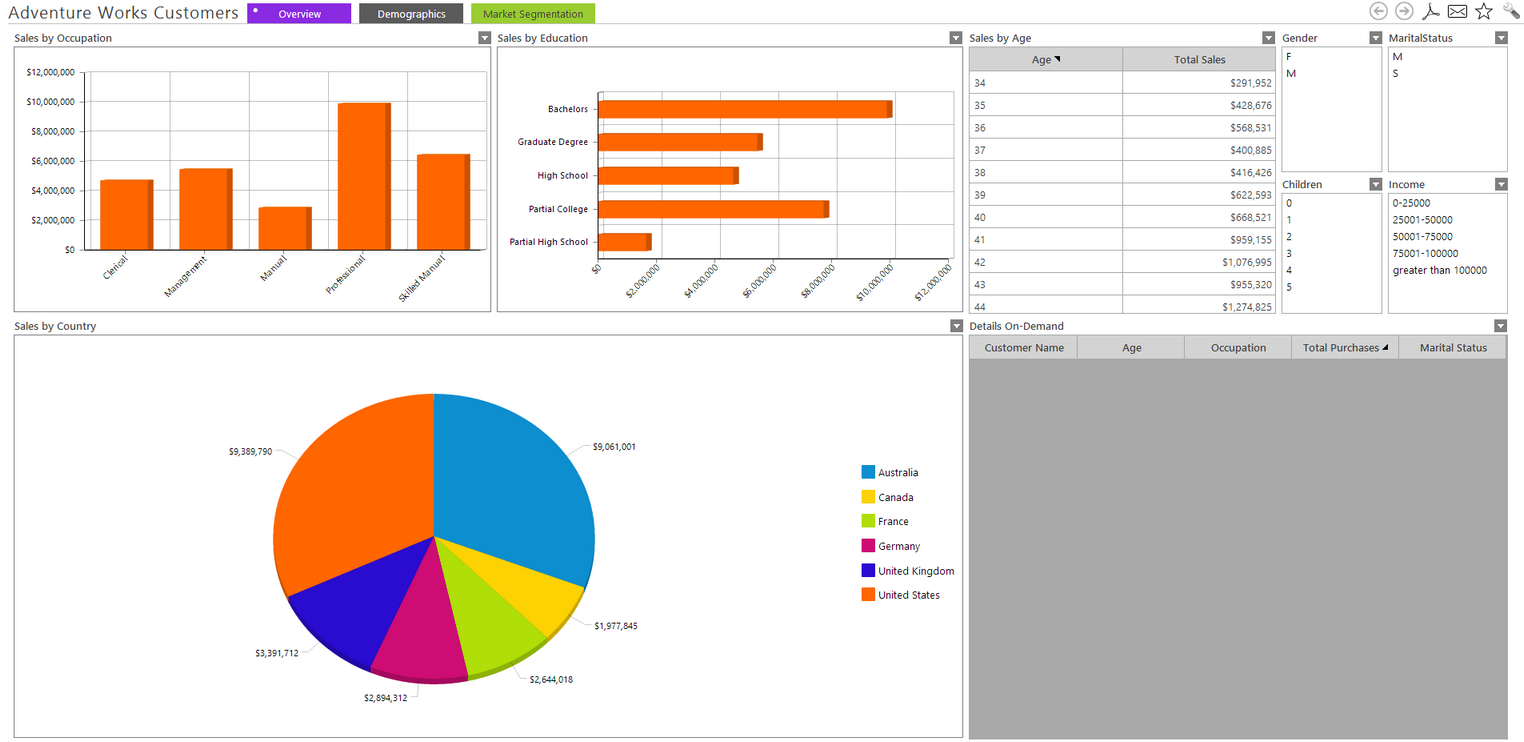
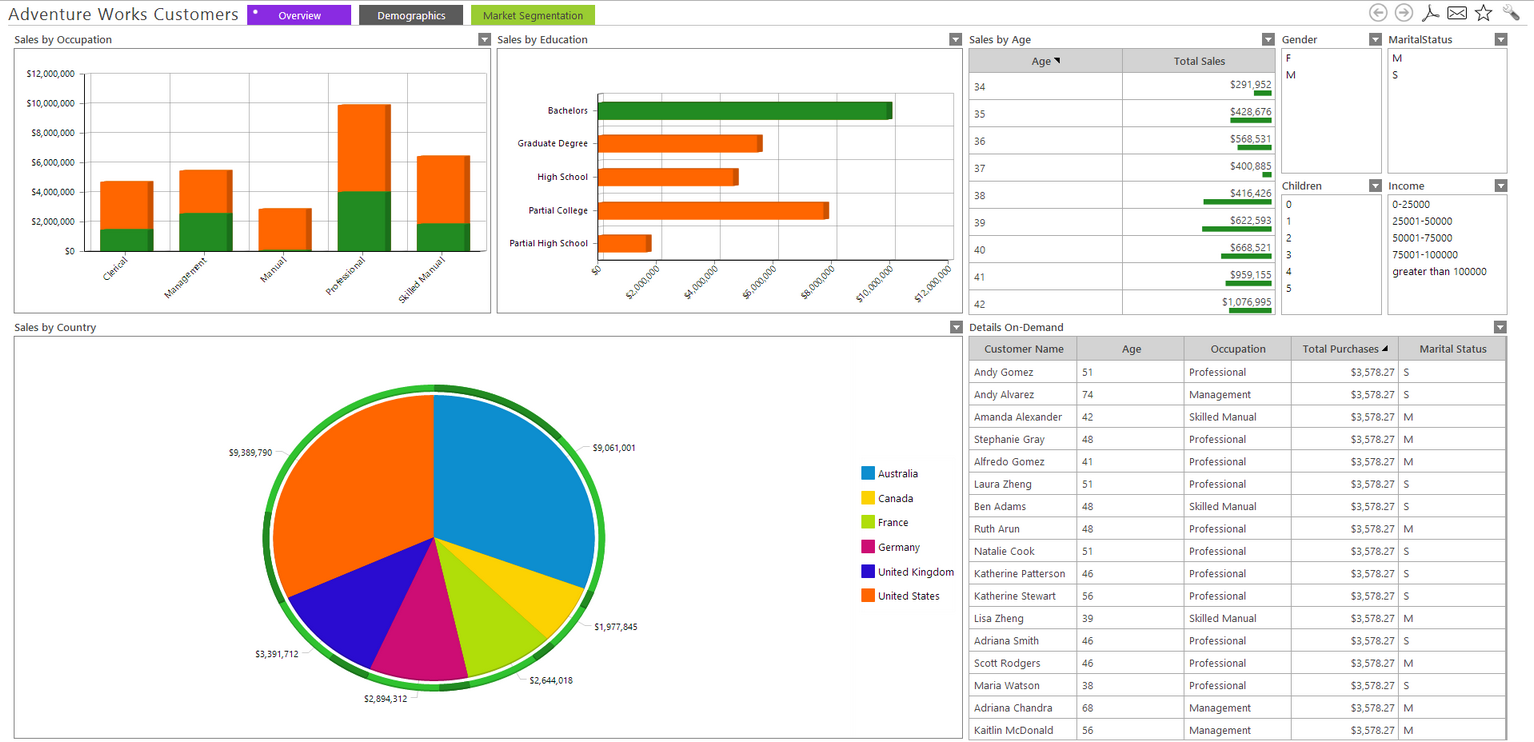
In this example the following widgets have the same marking group, Green, Sales by Occupation, Sales by Education, Sales by Country and Sales by Age.
When any of these widgets are interacted with by your dashboard user, all the other widgets will mark the relevant information. Lets say that we would like to see our of all of break down of information relevant to the sales made by people with a Bachelors degree. Figure 4 and Figure 5 will show you the before and after of the dashboard with the widget marking.

Figure 4: Dashboard before selection.

Figure 5: The dashboard after selection.