|
Advanced Charts Options |


|
The Advanced options for all the different Chart types are the same. These options are highlighted below.
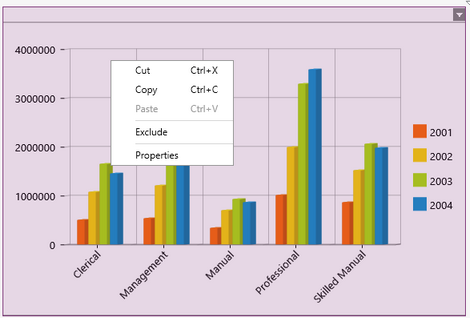
1. Right click on the Chart that you want to open the Properties Pane for.

Figure 1: The contextual menu displayed when right clicking.
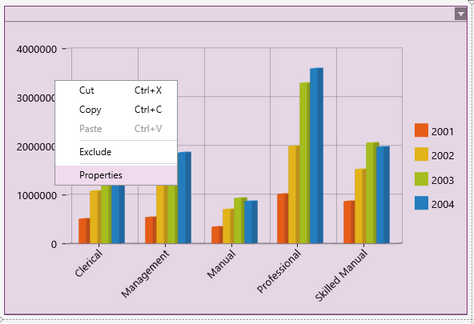
2. From the resulting contextual menu select the Properties option.

Figure 2: The Properties option is highlighted in the contextual menu.
3. Select the Chart target object in the Navigation Bar.
![]()
Figure 3: A chart target object is selected.
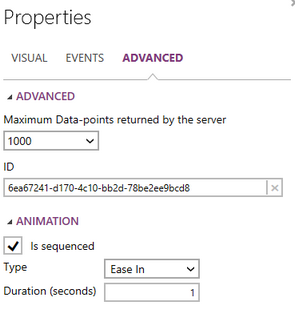
4. Navigate to the Advanced section.

Figure 4: The Advanced Section in the charts Properties Pane.
5. You can edit the maximum data points that will be returned by the server, and presented to your dashboard user.
6. By default when you create a Widget in the BI Architect an unique ID will be created. You will have the ability to edit this ID of the selected Widget as you see fit. This ID must be a unique ID from all widgets in your dashboard.
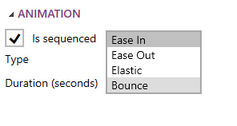
7. You have the option to add animation to your charts. This animation will be seen by your dashboard user when they first open the dashboard. The Pie Chart will allow you to select if you would like the animation to Fade-in.

Figure 5: The animation options for chart widgets.