|
Adding Java Script |


|
For some Visualization Widgets you will have the option to add custom javascript commands that will be executed when your user selects the Widget in the dashboard. You can add javascript to the following widgets: Chart, Map Chart, Table, Pivot Table and Cross Table.
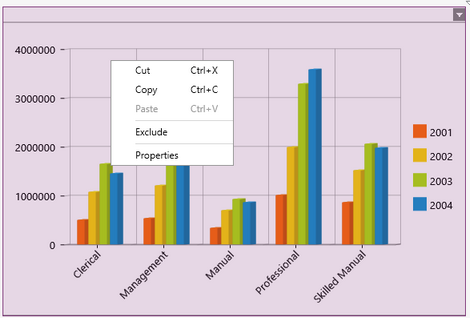
1. Right click on the widget that you want to open the Properties Pane for.

Figure 1: The contextual menu displayed when right clicking.
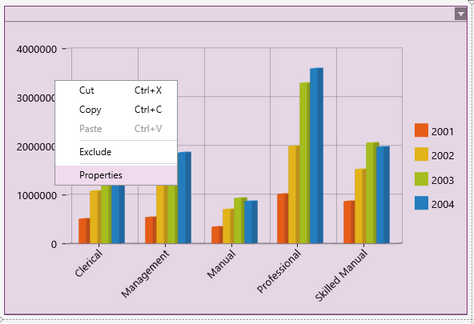
2. From the resulting contextual menu select the Properties option.

Figure 2: The Properties option is highlighted in the contextual menu.
3. Select the widgets target object in the Navigation Bar.
![]()
Figure 3: A chart target object is selected.
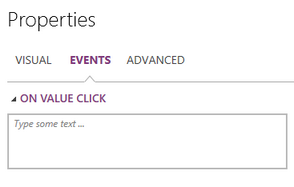
2. Navigate to the Events section.

Figure 4: The Events section in the Properties Pane.
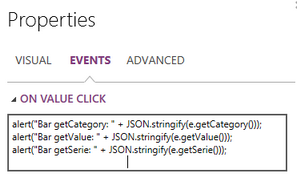
3. In the On Value Click section add your javascript commands.

Figure 5: Sample javascript has been added to a Bar Chart widget.