|
Changing Chart Fonts |


|
1. Right click on the Chart that you want to open the Properties Pane for.
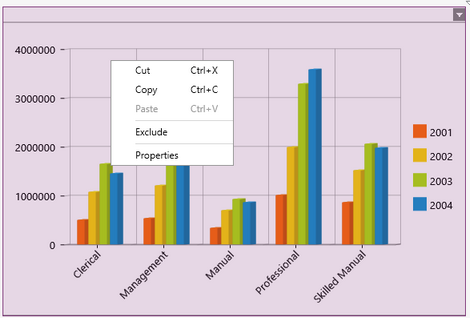
Figure 1: The contextual menu displayed when right clicking.
2. From the resulting contextual menu select the Properties option.
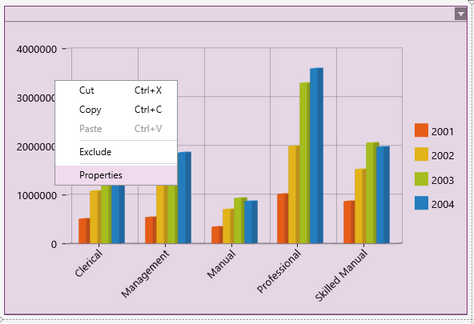
Figure 2: The Properties option is highlighted in the contextual menu.
3. Select the Chart target object in the Navigation Bar.
![]()
Figure 3: A chart target object is selected.
4. View the different Chart Font options has outlined below.
Font Type
To change the font type, select any of the available types from the drop down menu.
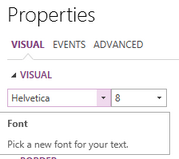
Figure 4: Pick a new font for your text.
Font Size
To adjust the size of the font in your chart you have two options.
1. Select the necessary size from the drop down list.
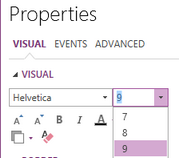
Figure 5: Select the desired font size.
2. Use the Increase and Decrease font size buttons.
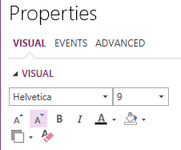
Figure 6: The decrease size button is highlighted in the Properties Pane.
Text Color
You are easily able to change the font color of your chart.
1. Select the Font Color button.
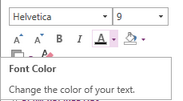
Figure 7: The Font Color button is highlighted.
2. From the Resources tab, you can select from any of the predefined colors and select apply.
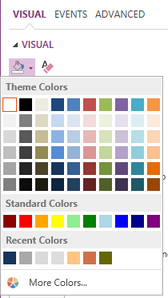
Figure 8: Select a predefined color scheme.
3. From the Editor tab you are able select and customize any color to meet your needs.
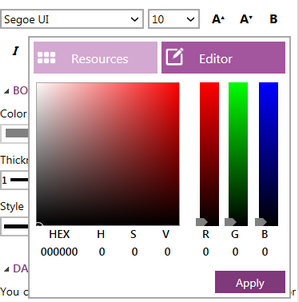
Figure 9: Select and customize any color.
Background Color
You are easily able to change the background color of your chart.
1. Select the Background Color button.
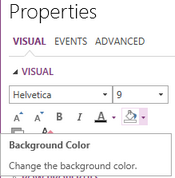
Figure 10: The Background color button is highlighted in the Visual group.
2. From the Resources tab, you can select from any of the predefined colors and select apply.
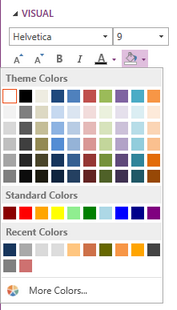
Figure 11: Select a predefined color scheme.
3. From the Editor tab you are able select and customize any color to meet your needs.
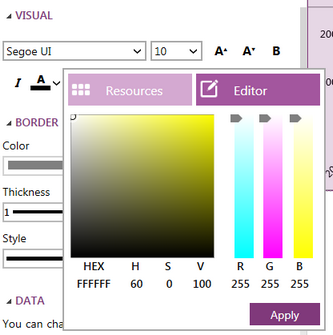
Figure 12: Select and customize any color.
Clear Formatting
An important option that you will have when working with the text of your chart widget is the ability to clear the formatting of the whole chart.
Select the Clear Formatting button and the chart will reload to the original format when it was first inserted into the design surface.
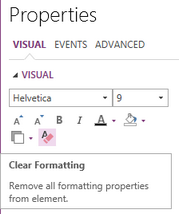
Figure 13: The Clear Formatting button highlighted in the Properties Pane.
Next Steps
Adding Chart Boards - Learn how to add a border to the entire Chart.
Editing Chart Data - Learn how to edit Chart data after inserting the widget.
Chart Axis - Learn about the configuration options you have for the Chart Axis.
Series Options - Learn about the options you have to configure the Charts series.
Displaying a Scroll-Bar - Learn how to display a scroll-bar in your Chart.
Chart Legend - Learn about the options to edit your Charts legend.
Caption - Learn how to customize the Chart caption to meet your needs.
Widget by Marking - Learn how to use marking to relate your inserted widgets.
Filter by Marking - Learn how to configure your widgets to filter depending on the markings you have set.
Advance Chart Options - Learn about the advance options you can use to customize your chart.
Adding Java Script - Learn how to add javascript to your Charts.