|
Insert Pivot Table |


|
Pivot Tables can be an excellent way to provide the ability to easily expand and collapse data to display information that is relative to their needs. They are useful for grouping based on shared data points and also for summarizing within these groups.

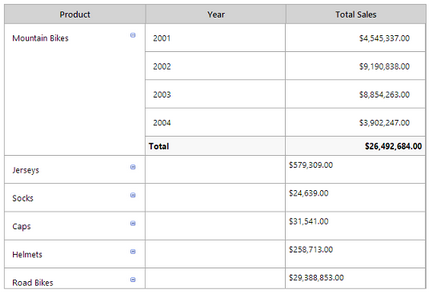
Figure 1: A Pivot Table displaying information expanded to show summary sales information by product and year.
The example in Figure 1 demonstrates using a Pivot Table to provide viewers with the opportunity to investigate the sales totals per year by product. Additionally summaries can also prove useful such as the total sales per product as reflected above.
Access
To learn how to access the Insert Pivot Table dialog please visit the helpful page on Inserting Visualization Widgets for the specific display mode you are using, Mouse or Touch.
Usage
The BI Architect will prompt you to specify the information that you wish to have displayed in your Pivot Table. Use the Dialog Bar to complete the setup of the table as specified in the examples below.
Figure 3: Row Group options in the dialog bar. |
Figure 4: Table Value options in the dialog bar. |
A Row Group is added to first group by Product and then again to group by Year. These Row Groups will be represented as columns in your pivot table.
A Table Value is added to sum the values for RetailSaleAmount in the resulting group sets. The Table Values specified will also be represented as additional columns.
Using the Sum function is an example of using an Expression. You can select the Functions Button to insert or build your own Expression.
You may also wish to apply a local filter to your widget. To do so, select Edit in the Filters options. Visit our helpful section on working with local filters, to learn more.
Select Insert to complete the setup and preview your Pivot Table in the Design Surface.
Additional modifications can be applied in the Pivot Table Properties by selecting the table in the Design Surface and selecting Properties Pane button in the Side Menu or the Ribbon.
Related Topics
You may also be interested in the following topics.
Widget Marking - It is important to think about your final dashboard throughout the entire design process. Link widgets through powerful coloring and filter displays in your dashboards using marking.
Aligning and Resizing Dashboard Objects - Lean about organizing and resizing your dashboard objects.