|
Inserting Visualization Widgets |


|
In order to display your data in powerful and meaningful ways, you will need to insert Visualization Widgets. These widgets will display your data in the form of tables, charts, gauges, and other variations. This section is to assist you in finding information on how to insert a Visualization Widget, but also where to find helpful information on configuring each.
Using the Insert Tab
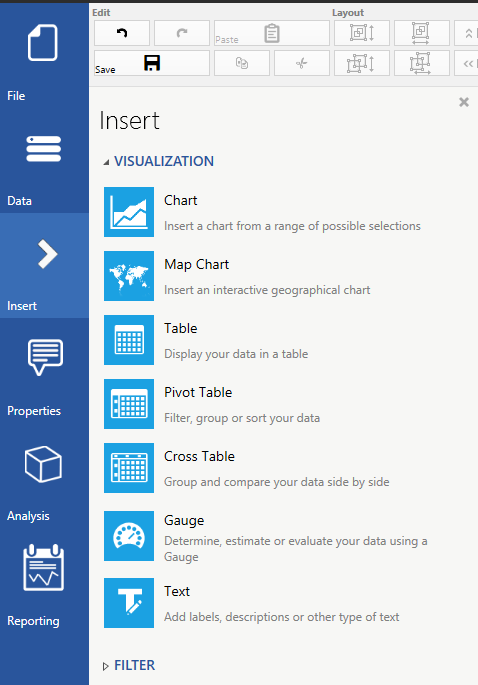
At this point, you have already connected to a an In-Memory Database which will allow you access to features located in the Insert Tab. Here you can simply find the Visualization Widget you would like to insert and select that button in the Side Menu.
| 1. | Select the Insert Tab in the Side Menu. |
| 2. | Locate the Visualization Group. |
| 3. | Select the Visualization Widget you would like to insert. |

Figure 1: The Visualization Group is located in the Insert Tab in the Side Menu.
What to Expect
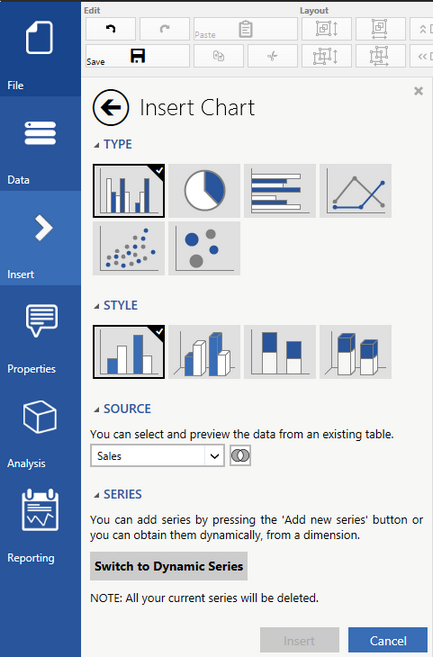
You should now notice a dialog menu located to the left of the Design Surface that will help you configure the Widget for inserting into your Dashboard. You will need to use this dialog to configure choices like type, style, what data is to be displayed, and much more. All of your Widget setup will be done right in that helpful dialog.

Figure 2: The Insert Chart Dialog is displayed for simple configuration after selecting Chart from Insert Tab.
Where to Find Information on Each Type of Visualization Widget
Now you know where to locate the Visualizations Widgets for insertion and you also know that you have to configure them through the resulting dialog to the left of the Design Surface. However, you will need helpful information on configuration options for all widgets as each type of widget can have its very own set of options. Below, we've provided helpful links to the documentation for every type of Visualization Widget that you may wish to add into your Dashboard.