|
Insert Cross Table |


|
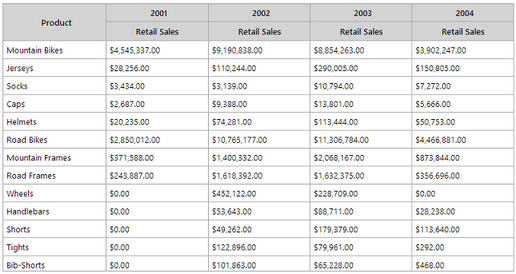
Cross tables are powerful table structures to investigate the correlation trends among data points as well as providing a visual manner to compare data side by side.

Figure 1: A cross table used for annual sales comparison.
Description:
The example listed above demonstrates the use of a cross table to investigate the sales results per year for each product. Such a table will allow you to investigate how well a product sold in each year and perhaps notice trends among data points. This side-by-side comparison can help us analyze if, for example, the dip in sales for Mountain Bikes from 2003 to 2004 was related to a company wide in-store display model change, or simply a part of an overall trend in product sales as reflected for each product in the table in 2004.
The Ecrion BI Architect allows you to easily set up your desired Row Groups, Column Groups, and Table Values to be displayed. Using the example provided above in figure 1, the configuration of such a cross table is done in the Dialog Bar after selecting to insert a cross table.
Access
To learn how to access the Insert Cross Table dialog please visit the helpful page on Inserting Visualization Widgets for the specific display mode you are using, Mouse or Touch.
Usage:
|
|
|
|
Figure 2: Selection for Source |
Figure 3: Configuration for row groups |
Figure 4: Configuration for column groups |
Figure 5: Configuration for table values |
To set up the cross table as reflected in figure 1, the following configuration steps were used:
The tables "Sales" and "Product" were selected to be the source where the data for the Cross table will be pulled from.
A Row Group was added to vertically group the ProductCategory field. The Label was modified to display "Product" and the ProductCategory field was selected from the available fields in Field drop down menu.
A Column Group was added to horizontally group the data by the Year field. The OrderDate field was selected from the list of available fields in the Field drop down menu. Note, that any fields used for row grouping will not be available in this selection.
A Table Value was added to sum the retail sales. In the cross table, this sum will be calculated for each year as specified in the Column Group. The Label was manually changed to display "Retail Sales", and the sum of the RetailSaleAmount was specified by first selecting the field from the Field drop down menu and then selecting the Functions Button to choose Sum.
Using the Sum function is an example of using an Expression. You can select the Functions Button to insert or build your own Expression.
You may also wish to apply a local filter to your widget. To do so, select Edit in the Filters options. Visit our helpful section on working with local filters, to learn more.
Once you have completed adding the necessary components for your cross table, select Insert at the bottom of your dialog and the cross table will appear in the Design Surface. Here you can resize and position as desired.
For further modifications available in the Cross Table Properties, you can select the table in the Design Surface then select Properties Pane button from the Side Menu or the Ribbon.
Related Topics
You may also be interested in the following topics.
Widget Marking - It is important to think about your final dashboard throughout the entire design process. Link widgets through powerful coloring and filter displays in your dashboards using marking.
Aligning and Resizing Dashboard Objects - Lean about organizing and resizing your dashboard objects.
Inserting a Cross Table - You can view helpful video tutorial on how to configure and insert a cross table, as well as how to edit the table using the Properties Pane.
Tutorial:
Inserting a Cross Table - In this tutorial you will learn how to configure and insert a cross table, as well as how to edit the table using the Properties Pane.