|
Adding Pivot Table Borders |


|
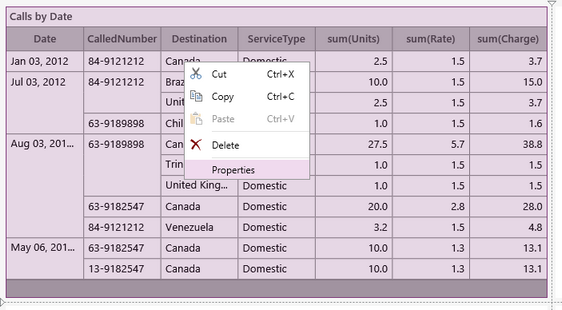
1. Right click on the Pivot Table that you want to open the Properties Pane for.
2. From the resulting contextual menu select the Properties option.

Figure 1: The Properties option is highlighted in the contextual menu.
3. Select the Pivot Table target object in the Navigation Bar.

Figure 2: The Pivot-table target object is selected.
4. Select the color you would like the boarder to be. Similarly to the color options for Pivot Table Fonts you will be able to select from one of the predefined colors or create your own to meet your needs.
5. Select how thick you would like to boarder to be in the out put.
6. Select the sides of the diagram to indicate where you would like to have borders on your Table.

Figure 3: Borders were added to the cross bars of the table.
NOTE: When making any changes to the border options (color or thickness) you will need to first deselect then reselect the boarder in the diagram to apply the changes.
Next Steps
Editing Pivot Table Data - Learn how to edit Pivot Table data after inserting the widget.
Row Groups - Learn about the options you have to edit the table row groups.
Header - Learn about the options you have to edit the table headers.
Totals -
Caption - Learn how to customize the Pivot Table caption to meet your needs.
Widget by Marking - Learn how to use marking to relate your inserted widgets.
Filter by Marking - Learn how to configure your widgets to filter depending on the markings you have set.
Advance Chart Options- Learn about the advance options you can use to customize your chart.
Adding Java Script - Learn how to add javascript to your Charts.