|
Using BI Architect |


|
The BI Architect is designed to provide you with a simplified means of creating powerful Dashboards. These dashboards will be viewed by your target audience to analyze your enterprise data and make valuable and educated business decisions. When you begin designing your dashboards, it is important to have a target objective for that dashboard in relation to the data. Here are a few examples:
1. I want my sales team to be able to research trends in product sales to determine which product's sales are increasing and which are decreasing over time.
2. I want our sales management team to be able to view side by side comparisons of sales team members' performance over the last two years.
3. I want our global expansion team to be able to analyze how a specific sales region is performing in proportion to overall sales.
Once you have determined your objective, now you can choose from two options to get started on your dashboard.
Usage
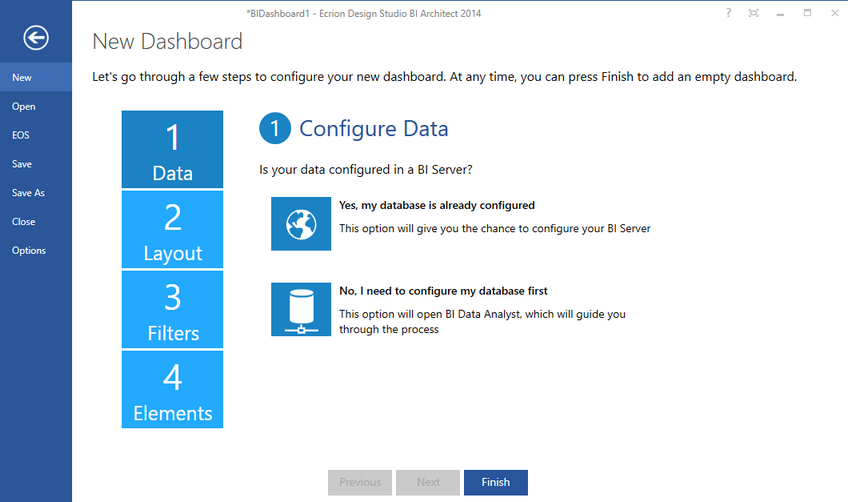
When you first open the BI Architect, the New Dashboard screen will be displayed. You must first determine if you wish to design and configure a new dashboard independently or use the new dashboard Wizard. This menu can also be accessed by selecting the File option in the Side Menu or in the Ribbon.

Figure 1: The New Dashboard screen is the first step in designing your dashboard
Your First Decision
The first choice you will need to make is if you would like to design a dashboard with the assistance of the new dashboard Wizard or build your own from scratch.
| • | If you would like to design a new dashboard independently, you can simply select Finish at any point and then configure and design on your own using assistance provided here: |
Configuring a Dashboard - here you can start with an empty dashboard and design independently.
| • | If you would like to use the dashboard Wizard to assist you in your design, you can use the Next and Previous buttons to navigate through the configuration and design of your dashboard. |
Creating a New Dashboard - here you can design a dashboard using step by step guidance provided by the BI Architect new dashboard Wizard.
Primary Steps in Dashboard Design
Now that you have decided how you want to design your dashboard, you will need to explore the primary steps that are involved from start to completion. These steps are listed below:
| • | Working with Widgets - The bulk of the work when creating a dashboard is deciding what information to present and how to filter it. Widgets help you do just that. |
| • | Generating Previews - After finishing the design, a live preview can be generated. This live preview lets users interact with the dashboard, just like an end-user would. |
| • | Reporting - This section describes how to configure not only the automated reporting that is part of every Ecrion dashboard, but also one or many custom reports. |
| • | Saving and Exporting - Once complete, the dashboard can be exported to HTML and integrated into a web site where all users can access it. |