|
Generating Previews |


|
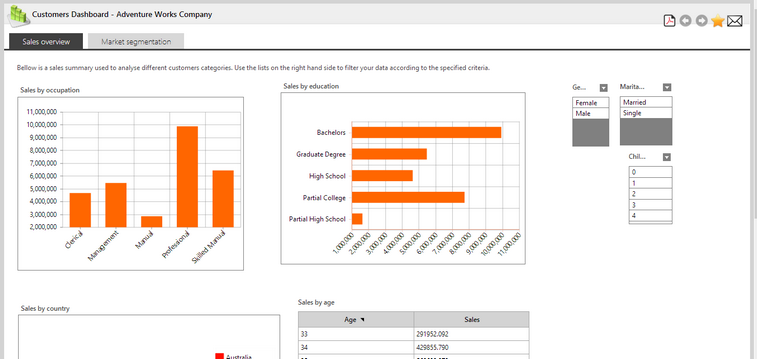
When you are designing your dashboard, you may frequently want to check the output behavior of your widgets. The Preview button in the Toolbar will allow you to view the HTML version of your dashboard as it will be available to your viewers. This includes populating your widgets with the entire data set, investigating resize behavior, and allowing you to test the functionality of Filters if present.
Figure 1: The Adventureworks Sales sample in dashboard design view |

Figure 2: The Adventureworks Sales sample in preview
Usage
By clicking on the Preview button in the Toolbar, the BI Architect will launch the HTML version of your dashboard in your default web browser. Here you can interact with your dashboard to test behaviors and correct data population needed for your objectives. You can also test run your Reports by clicking the reporting button at the top right of the Preview screen.
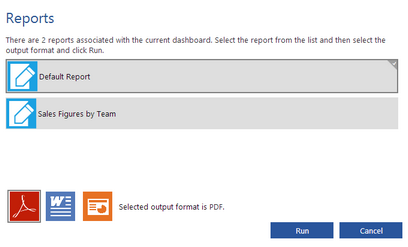
The example below highlights the options available to you. These include choosing the report you wish to use (see Reporting), choosing your output format, and selecting to Run.

Figure 3: Options available when selecting the Generate Report button.