|
Understanding Your Data |


|
As the designer of dashboards for your Business Intelligence needs, you will need to have an understanding of the data that is available to you. For the use of the BI Architect, you will have access to data in the form of an In-Memory Database. Within, you will find that you can base your Widgets around data in the form of Dimensions and Measures. However, it is first important to understand what actual values reside in, for example, a particular dimension.
A Starting Point
One great place you can start is to simply view the available dimensions in your In-Memory Database. To do so you must first connect to an In-Memory Database. You can do so by first visiting the help section Configuring Data.
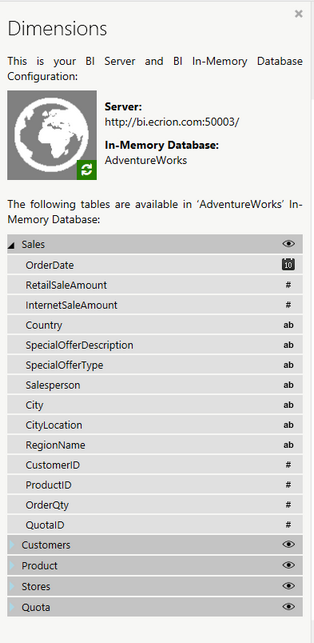
Once you have successfully connected to your In-Memory Database that will be used for your dashboard, you can take a look at available dimensions selecting Data in the Home Tab in the Ribbon. Figure 1 below displays the dimensions available in the Adventureworks Sales In-Memory Database sample that comes with the installation of the BI Server.

Figure 1: The available dimensions are displayed in the Dimensions Dialog.
This helpful view will allow you view the dimensions that you will work with in designing your dashboard. However, perhaps you did not design this data or are unfamiliar with what values may reside within each dimension. You might be left with questions such as:
1. What is the difference between City and CityLocation?
2. What type of information will come from the RegionName dimension?
Not to worry, as this is not an uncommon scenario. Often times, you may not be the individual that structures this data, so it is important to develop an understanding of what types of values are contained within each dimension before you get started.
Investigating Values in a Dimension
There are a few ways to view the data that is contained in your inserted Database.
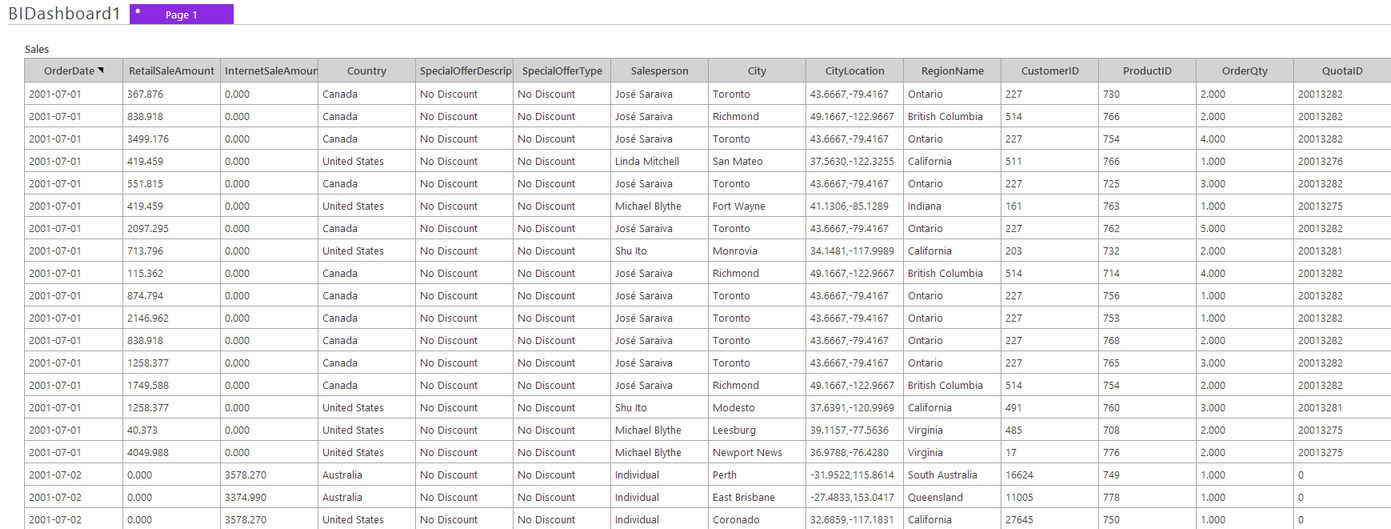
1. The easiest way you investigate what data each of your dimensions contains is to simply select the Preview Table button to the right of any table name, for example, Sales. This will launch .your default browser, and will display, in table format, all of the data within the selected table

Figure 2: All of the data points for the dimensions in the Sales table.
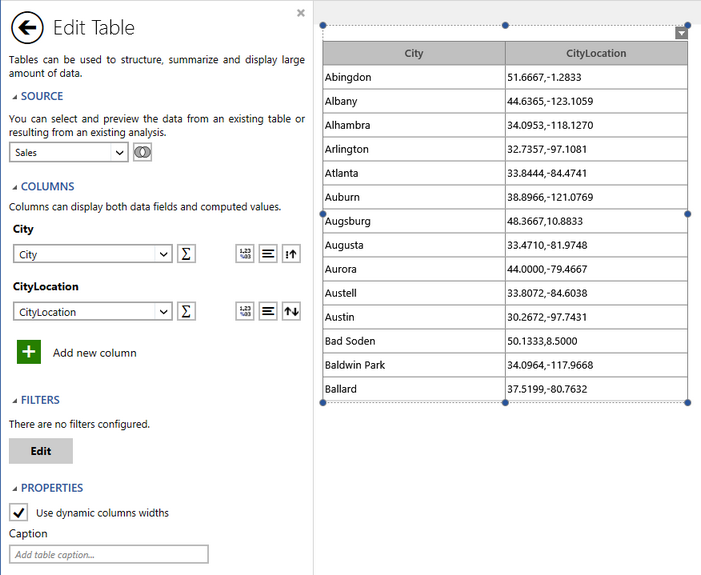
2. You may also want to simply add a table into your dashboard and preview the dashboard. Let's take the example above and demonstrate for you. At first glance, you may not know what the difference between City and CityLocation are. You can simply insert a table with two columns to see what these two dimensions consist of, and more importantly, understand the relationship between the two.

Figure 3: Using a table to view values.
In Figure 3, we have simply inserted a table with two columns: ProductName and ProductCategory. To insert a table into the dashboard for such a purpose, you will simply need to visit the help section on inserting a table. Now that we have our table available to us in the Design Surface, we can easily see a preview of some of the values that are contained in each dimension.This table gives us enough information to understand the relationship between these two dimensions. As you can see each City contains the various city names and each of those cities has an associated longitude and latitude coordinate.
You can repeat this process for any dimension you would like by simply changing the columns within the Table Properties dialog. This helpful process will allow you to gain an understanding of what values will drive your Widgets.
3. For a quick reference for the type of data that is within each dimension, you will notice that to the right of every dimension there is a symbol indicating what the data type is.
|
This icon indicates that the value for the dimension is a Date. |
|
This icon indicates that the value for the dimension is a Number. |
|
This icon indicates that the value for the dimension is a Text Value. |
Getting a clear picture of your data will allow you to move forward in structuring your Viewer Target Questions.