|
Viewer Target Questions |


|
A Viewer Target Question is a question designed by you to represent the perspective of your dashboard viewers. Before you can start the design of your dashboard, you will need to think about your audience and the questions they would like to have answered. It is beneficial to even make a list of these questions. For each of these questions, with a good understanding of your data, you can then design Widgets that will answer those questions.
Questions for You
As the designer of the dashboard that these viewers will use, you must ask yourself a few questions first.
1. Who is your audience?
2. What information is important to this audience?
3. What type of questions will they want answered?
Designing Viewer Target Questions
Let's think about our audience. For example, let's imagine a scenario where we are designing a dashboard designed for our sales management team. The sales management team will now be our target audience for this particular dashboard. This small team of management professionals make important decisions on hiring, territory improvement and expansion, and product sales performance. You can take each one of these decisions as helpful information in determining what type of data is important to them.
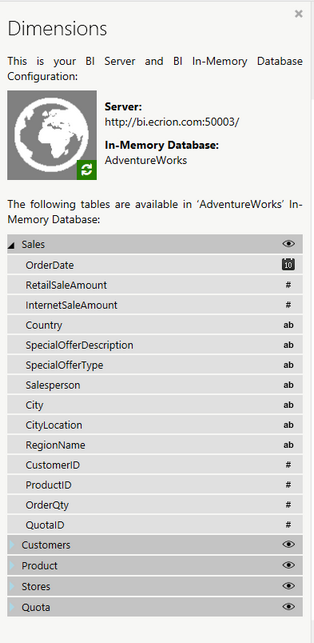
Lastly, let's consider our viewer target questions based on this information. It is recommended to make a list of these questions as they will help you in determine what type of Widget will be used and what Fields (dimensions) you will use for each. So, imagine you are on this sales management team. What types of questions would you be asking? Here are a few examples based on this example In-Memory Database:

Figure 1: The AdventureWorks Sales available dimensions.
1. Which Sales Person did the best?
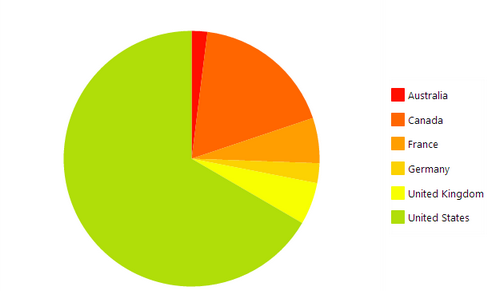
2. What proportion of total retail sales came from each Country?
3. How did each product ID perform over the last four years?
The three examples above demonstrate setting viewer target questions as if you are the target audience. To describe the entire process, you can take, for example, question 2 above on proportional information on city sales. Often times, proportional information is best displayed with a Pie Chart. With such a chart, our audience can visually see which territories are performing better than others. So, you will now need to make a note that you will look to create a pie chart to answer this specific question. Here is an example of how your audience can easily get that information when simply viewing your dashboard.

Figure 2: A viewer target question answered with a pie chart.