|
Tutorials |


|
The BI Architect comes with sample dashboards for you to use as learning tools. These dashboards can be useful planning your dashboard design as well as referencing the properties of the widgets to view configurations. Below are brief descriptions of each sample dashboard.
BI Architect Tutorial Videos
An Introduction to the Ecrion BI Architect - This video introduces the Ecrion BI Architect and the different ways that users can customize their experiences. Topics include changing the display mode and learning about the ribbon features.
Connecting to and Working with an In-Memory Database - In this video you will learn about the first step in designing your dashboard. Topics include connecting to a BI server, selecting an in-memory database, how to view data represented in available tables, and how to change your data connection.
Inserting a Chart Widget - In this video you will learn how to insert and configure a chart widget, as well as how to edit the chart using the Properties Pane.
Using Charts with Dynamic Series - In this tutorial, you will learn how to switch to the Dynamic Series option and configure and insert a chart using Dynamic Series.
Inserting a Table Widget - Here you will learn how to insert and configure a table, as well as how to use the Properties Pane to edit the table.
Inserting a Cross Table - In this tutorial you will learn how to configure and insert a cross table, as well as how to edit the table using the Properties Pane.
Inserting a Gauge - In this tutorial video you will learn how to configure and insert a gauge, as well as how to edit the gauge using the Properties Pane.
Inserting a Filter Widget - Here you will learn how to insert and configure a filter widget, as well as how to edit the filter using the Properties Pane.
BI Architect Sample Dashboards
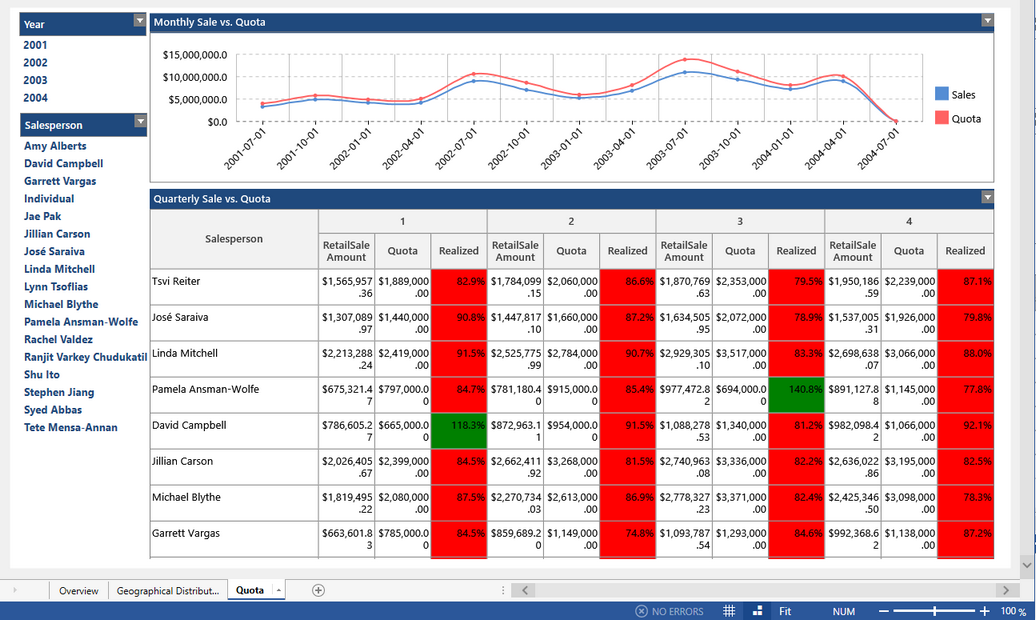
Adventureworks Retail Sales
This sample dashboard provides analysis of enterprise data related to the Adventureworks Sample In-Memory Database. Through the use of four pages, this dashboard displays sales figures related to products, regions, promotions, and more. The dashboard demonstrates the use of widgets such as horizontal bar charts, pie charts, list filters, tables, pivot tables, and more.

Figure 1: Adventureworks sales sample dashboard.
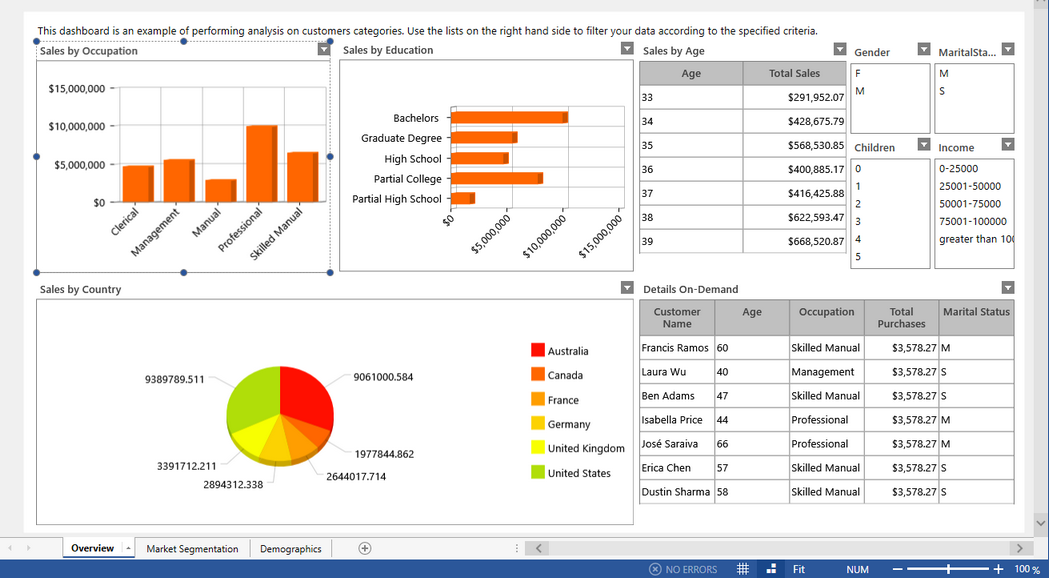
Adventureworks Customers
This sample dashboard provides analysis of enterprise data related to the Adventureworks Customers Sample In-Memory Database. Through the use of two pages, this dashboard displays sales data based on customer categories and more. Through the use of widgets such as horizontal bar charts, column charts, pie charts, tables, and filters, this dashboard provides analysis for sales by occupation, education, country, and age categories.

Figure 2: Adventureworks customers sample dashboard.