|
Design Before Design |


|
Once you have set a list of Viewer Target Questions, now you can begin considering how you want to answer these questions through the use of Widgets. For each question, you can think about what Widget would best meet the need to answer for your audience. You can learn about the usage of each type of Widget by visiting Working With Widgets.
Pencil and Paper
Although you can dive directly into designing your dashboard using the BI Architect, you may want to consider the structure and objects that will be used in your dashboard first. The BI Architect allows you to insert multiple widgets in a page, and each dashboard can contain many pages. You will need to answer questions such as the following, and using a pencil and paper to sketch the design might assist you to visualize the end result before designing each piece.
1. What widgets should I use to answer my viewer target questions?
2. Do I want to use more than one widget to answer a question for my viewers?
3. Do I want to create multiple pages that look at the data from multiple angles?
4. Is the position the widgets are displayed on the page important to me?
5. Do I want to add interactive components such as Filter Widgets to my dashboard to allow my viewers to customize their viewing experience?
By asking yourself such questions, you can begin to sketch out the overall structure of your finalized dashboard. This will allow you to design your dashboard more efficiently and even break the design into smaller components. Once you have a good understanding of your data, questions to be answered, and overall design before design, you are now ready to create a powerful tool by visiting Using BI Architect.

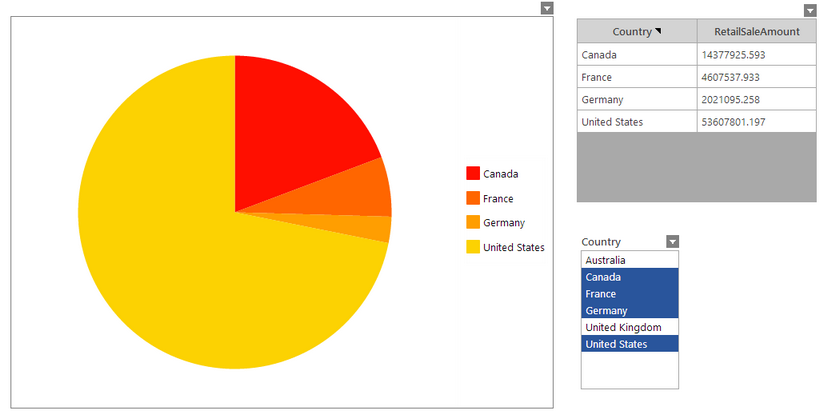
Figure 1: A dashboard with multiple widgets.