|
Chart |


|
Charts are Visualization Widgets used to display series of data in a graphical format to make it easier to understand large quantities of data and the relationship between different series of data. Before you can began working with your chart you will need to access the Insert Chart Dialog.
As the Chart widgets are one of the more common widget there are two ways to access this dialog.
Home Tab
1. Navigate to the Home Tab in the ribbon.

Figure 1: The Home Tab in the ribbon.
2. Select Chart button in the Insert group.

Figure 2: The Chart button highlighted in the ribbon.
Insert Tab
| 1. | Navigate to the Insert Tab in the Ribbon. |

Figure 3: The Insert Tab in the ribbon.
| 2. | Locate the Visualization Group. |

Figure 4: The Visualization group in the Insert Tab.
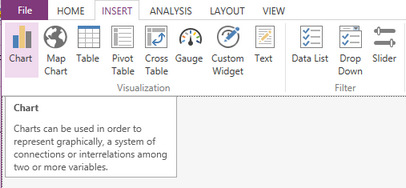
| 3. | Select the Chart button from the Visualization group. |

Figure 5: The Chart Button highlighted in the Insert tab.
Use the following pages to learn more about working with a Chart Widget.
Why use Dynamic Series - Lean about why you would want to use a dynamic series.
Column Charts - Learn how to insert a Column Chart.
Pie Charts - Learn how to insert a Pie Chart.
Horizontal Bar Charts - Learn how to insert a Bar Chart.
Line Charts - Learn how to insert a Line Chart.
Scatter Charts - Learn how to insert a Scatter Chart.
Bubble Charts - Learn how to insert a Bubble Chart.
Combination Chart - Learn how to insert a Combination Chart.
Chart Properties - Learn about how to edit and customize your chart after inserting it into the design surface.