|
Quick Insert Widgets |


|
In the BI Architect you are able to add some Visualization widgets to your dashboard by a simple drag and drop from your assigned database. You can insert a Column Chart, Bar Chart, Pie Chart or a Table. This section will highlight how to quick insert these widgets.
1. Navigate to the Home tab.

Figure 1: The Home tab in the ribbon.
2. Select the Data Source button from the Data group.

Figure 2: The Data Source button highlighted in the ribbon.
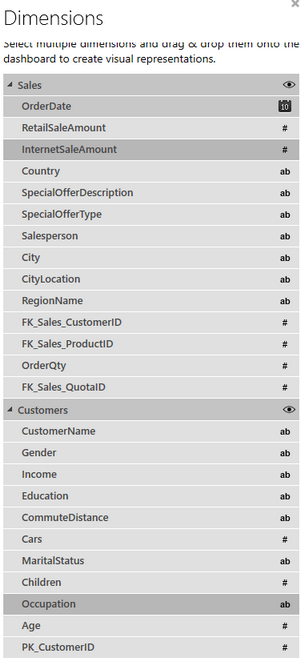
3. From the list of fields from your In-Memory Database select the field or fields that you would like to use to configure your widget. To select more than one field hold the control button down on the keyboard.

Figure 3: The fields InternetSalesAmount and Occupation were selected.
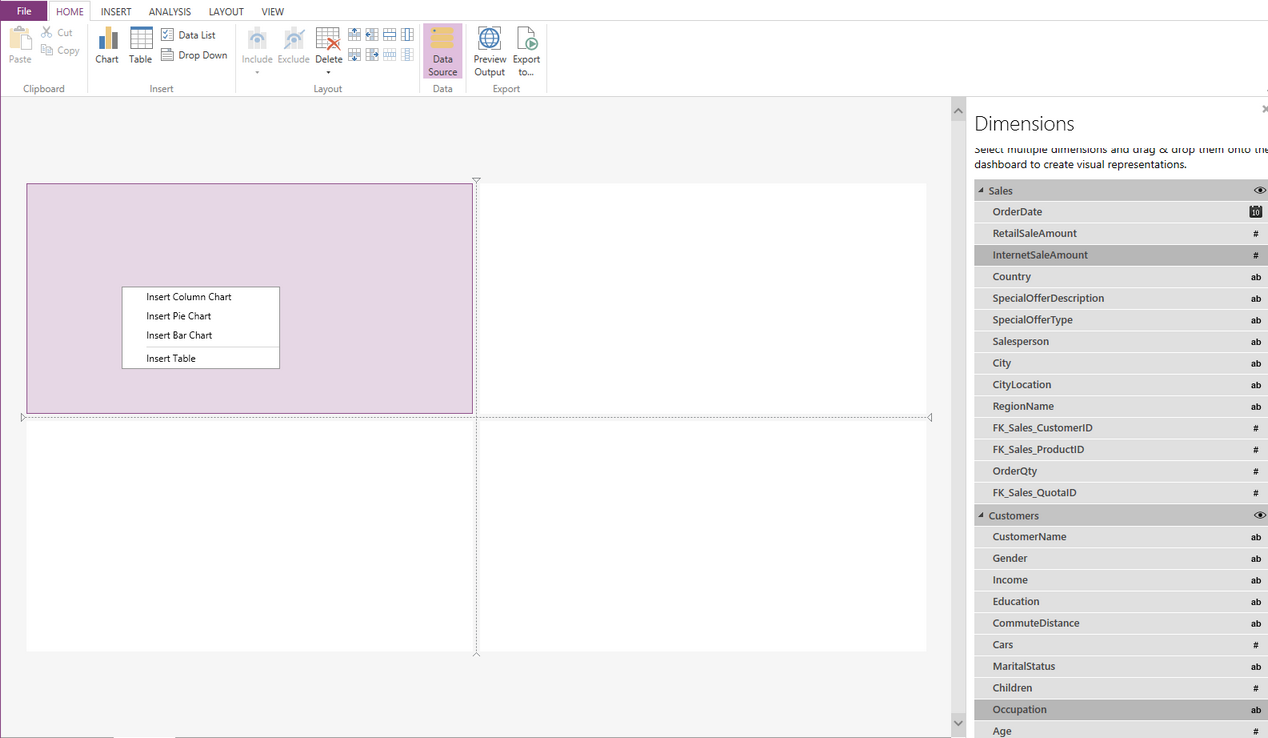
4. Once you have selected your fields, hold down the left mouse button and drag into your design surface and a contextual menu will be displayed.

Figure 4: The contextual menu displayed when adding fields.
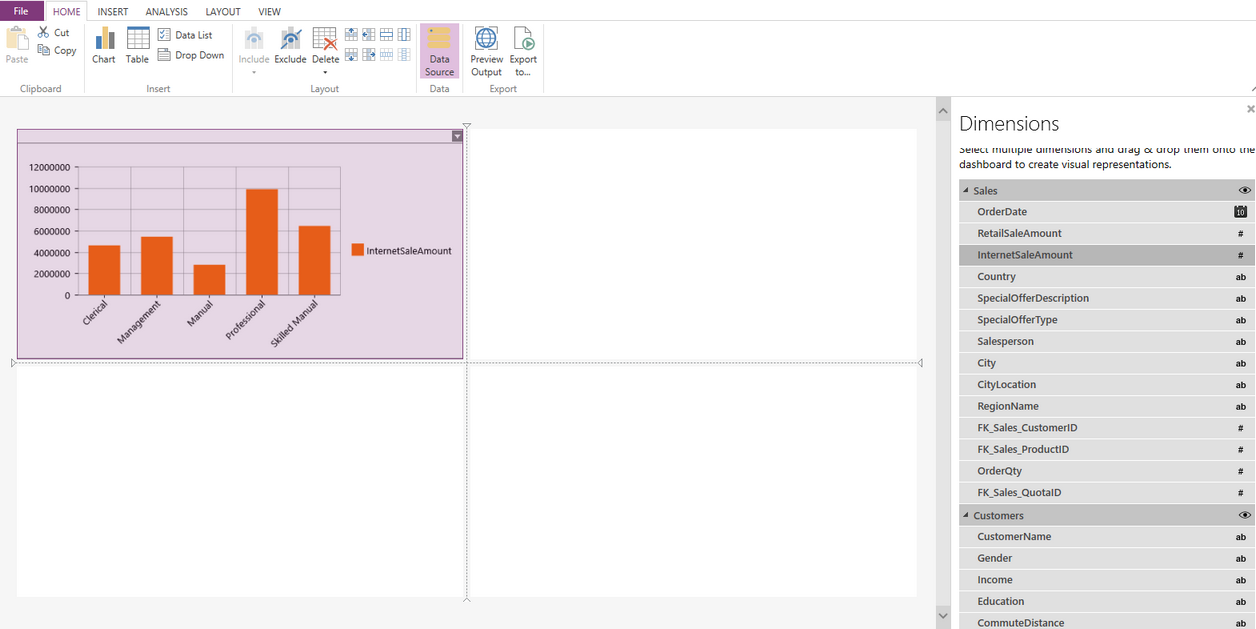
5. From the contextual menu, select which widget you would like to have inserted, and it will be populated into the selected cell.

Figure 5: A column chart has been inserted into the design surface.
6. After you have inserted your chart or table, you may wish to access the Properties Pane to further customize the widget to meet your needs.