|
Creating Data Connections |


|
|
Creating Data Connections |
|
A Data Connection is used to make a connection bridge from one diagram object to another. This relationship is called Data Mapping because we are creating a connection that will Map data from one Object to the next. You will normally begin using Data Connections to map data after you have inserted your desired Diagram Object. You will need to use these Data Connections to connect your source data to your desired Data Output.
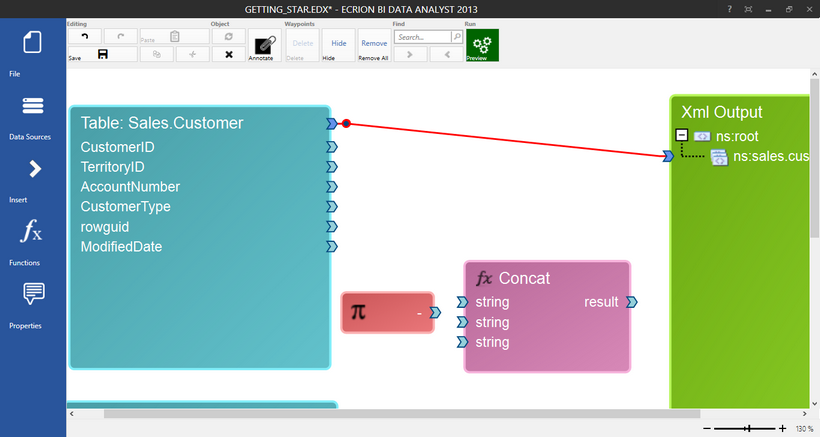
Figure 1: A Data Connection indicates a connection between the Input Source and the Output XML.
Usage
This section of the documentation describes how to use these Data Connections to assist you in bridging connections from your source data to your Output Data. There are a few important notes to be aware of when creating and working with Data Connections and these will be covered in the sections to follow.
Creating a Data Connection
You will notice that for every available field in your data source, a corresponding arrow will be displayed. These arrows are called Data Connectors, and you can learn more about the different types in the Data Connectors section of the help documentation. To create a Data Connection, you will first need to start by selecting this object. There are two arrow types that will be present when you are building your Data Diagrams.
| • | Light Blue Arrows - are used for connecting individual fields. These arrows are called Value Connectors. |
| • | Dark Blue Arrows - are used for connecting data sources. These arrows are called Data Set Connectors. |
To create a Data Connection either for an entire data set or an individual field, you must first select the arrow with your mouse. You will need to keep the left mouse button pressed and drag the mouse to make the connection. When you drag your mouse, you will notice a dashed line in the Design Surface that indicates your connection. At the end of this dashed line will either be an image indicating that you cannot connect to the desired object or an plus sign image showing that you can release the mouse to establish the Data Connection.
When you create a Data Connection using a Dark Blue arrow (data set connector), the BI Data Analyst will recognize that the entire set must be used and an Element Sequence will be used in the output. You may also use data set connectors to pass data sets to other functions such as filters. Notice in Figure 2 that we have first connected our Database table Sales.Customer to create a repeating Element Sequence in the output XML.
When you create a Data Connection using the Light Blue arrow (value connector), the BI Data Analyst will create a corresponding Attribute in the Output Data. In Figure 2, we have used these steps to connect CustomerID, Accountnumber, and ModifiedDate. You should be aware that in order to include our data points as children of the created Element Sequence, we must make sure to release the mouse button when the plus sign shows for ns:sales.customer Element Sequence. This will ensure that in our Output Data, these values will be populated for every customer.
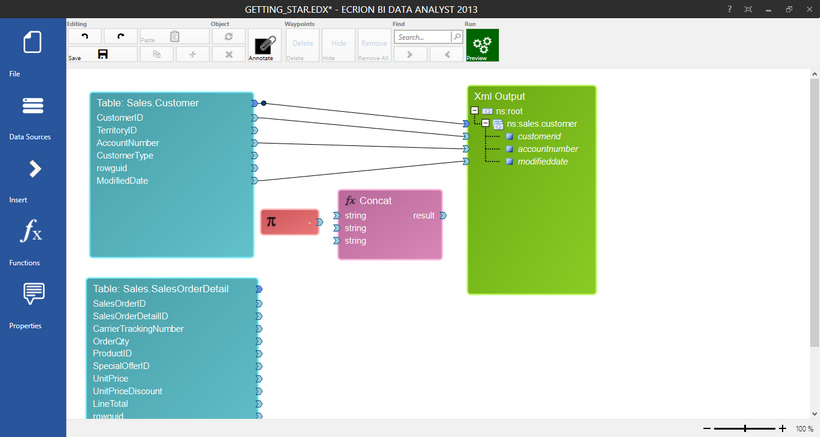
Figure 2: Data Connections are added for 3 Fields by dragging and dropping to make a connection.
Data Connections to Functions and Other Diagram Objects
Sometimes you will not be connecting directly to your Output Data, but will first need to bridge a data connection to a Function or other Diagram Objects. In such a case, you will need to make your connections by first selecting the output data connector of the input source and then releasing your mouse on the appropriate arrow of the Function or Diagram Object of your choice.
As an example, we will use the same Concatenate function as set up in the Adding and Working With Diagram Objects section of the documentation. Here we will simply drag each input source field value connector and our constant value connector to connect to each string Parameter in our Concatenate Function. You can notice that data connectors on the right side of an object indicate Outbound information whereas data connectors on the left side of an object indicate Inbound information.
In Figure 3, you can notice that we have connected the table data source for the SalesOrderDetail database table by creating a Data Connection from the data set connector to the ns:root element in the output XML. This creates a new element sequence for our SalesOrderDetail table. Next, the SalesOrderID, ProductID, and Constant values are connected to the input data connectors in the Concatenate Function and also a Data Connection is created to bridge the result of the Concatenation Function.
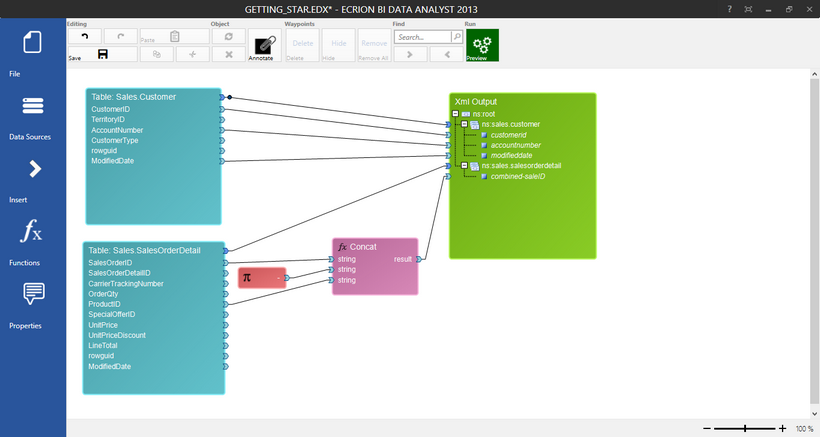
Figure 3: Data Connections are used to pass data from Input Source to Function and then include the result in the Output.
Visual Design Optimization
For better visual design, visit the help documentation section on using Waypoints to avoid intersections of Data Connections and Diagram Objects. Additionally, you can hide Data Connections if you would prefer this visual representation. To do so, simply select the Data Connection of your choice, and in the Toolbar, in the Waypoints group, select Hide. You will notice that the visual line for the Data Connection will now appear hidden, but an annotation will be used to specify either the target or source for each Data Connector. You can always display these Data Connections again by selecting either annotation, and again choosing Hide in the toolbar.
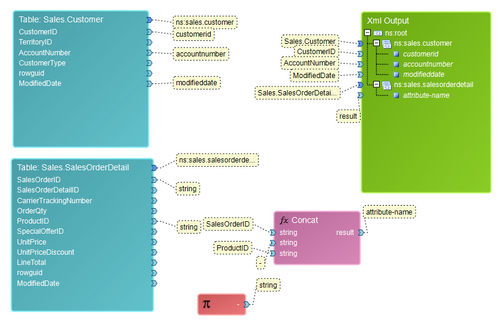
Figure 4: The Data Connections are hidden in the Data Diagram.
Once you have successfully mapped your Input Data Objects to Diagram Objects and ultimately created the Output Structure you desire, it is recommended that you preview the output often to investigate the behavior of your Data Diagram. To do so, you can select Preview from the Toolbar. You can learn more about using this helpful feature by visiting the Common Tools section of the help documentation. For this example, we've included an image of the provided output preview below. We have used the Preview option to make sure our Concatenate Function is generating the correct values.
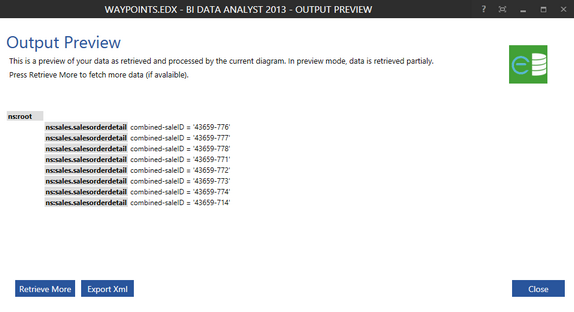
Figure 5: The Output Preview confirms that the Concatenation Function is working well.