|
Waypoints |


|
|
Waypoints |
|
You can use Waypoints to better organize the visual design of your Data Diagrams. When positioning Diagram Objects in your Data Diagrams, often times you may notice that Data Connections may overlap or be displayed under other Diagram Objects. You can modify each Data Connection to navigate around other objects in your diagram by creating Waypoints.
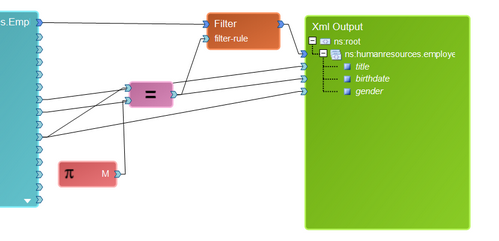
Figure 1: The Data Diagram with no Waypoints added to data connections.
In Figure 1, you can notice that the Data Connections mapping the output value connectors to the XML output are displayed behind the Equals Function. By selecting the Data Connection and dragging the mouse, a Waypoint is created. This step is repeated for all three data connections mapping the fields to attributes in the output XML.
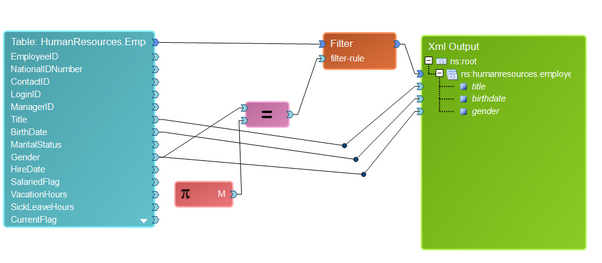
Figure 2: Waypoints are added to the Data Connections to display the data flow without intersection with other objects.