|
Group By |


|
|
Group By |
|
The Group By Command can be used to select records from a data source that generate distinct values for a specified field. This option can be particularly useful when you want to retrieve data for a particular group of fields sharing the same values of your choosing. In this section, you can find helpful information on when you would use a Group By Command and how you can insert them into your Data Diagrams.
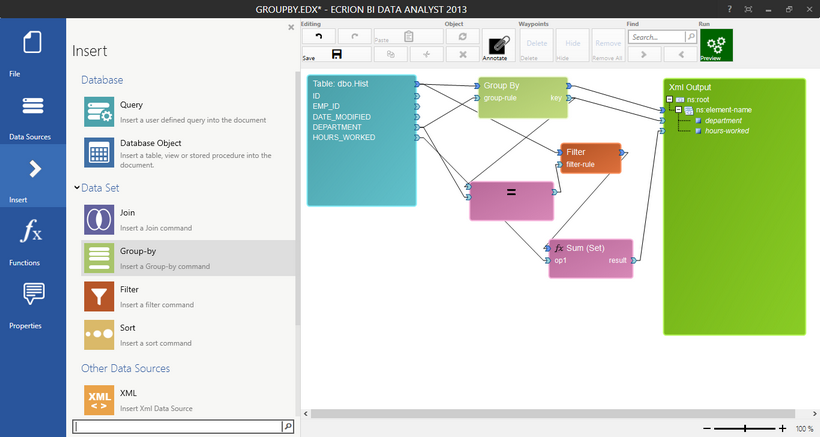
Figure 1: A Group By Command is used to sum hours worked for each department.
When to Use a Group By Function
An example of using a Group By Command in your Data Diagram would be if all sales data for a given year was stored in a table. This table could possess multiple occurrences for every product offered. If your requirement is to count how many of each product were sold in that given year, you can use a Group By Command to first group the data for every product, then use a Count Function to count the occurrences of every individual product value in the table. An example of such usage would reflect an output such as the following:
product="hats" count="234"
product="gloves" count="400"
product="pants" count="1320"
Usage
In order to successfully use a Group By Command, you will need to insert the necessary Diagram Objects that the group by function must rely on. To demonstrate this process, we will use the following scenario to highlight each step:
Scenario: We have a table holding all employee work information in our database. This work information includes fields noting the department and the hours contributed by each employee. Our need is to simply group our data for unique department values (sales, marketing, etc...) and display the total hours worked for each department.
To achieve this objective in the BI Data Analyst, we must proceed with the steps as follows.
Insert the Data Source You Wish to Group By
For this example, we first need to insert the Database Object for our Table. You can learn more by reading the Insert Database Object section of the help documentation. In this example, we've selected the dbo.Hist Table from our available tables.
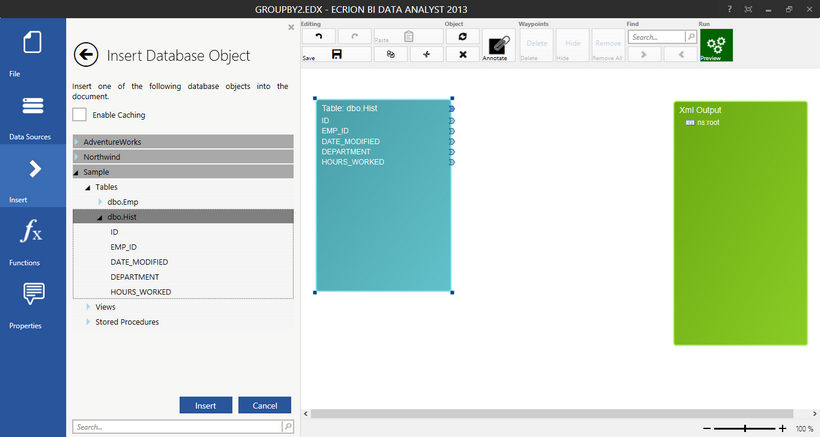
Figure 2: A Database Object (Table) is inserted into the Data Diagram.
Insert a Group By Command
By selecting Insert in the Side Menu, we can add a Group By Command to our Data Diagram. It is recommended to move this object between your input source and your output source. This option is available in the Insert Dialog in the Data Set group. Once inserted into your Data Diagram, you can notice that there are input arrows to map your source data set as well as the group-rule which will the field you would like to group by. The output arrows indicate where your Group By Data Connection can be made to your output data source as well as the Key to include. The Key will represent the actual value defining the group. In this example, the key will be the value for each department found in the table (sales, marketing, etc...).
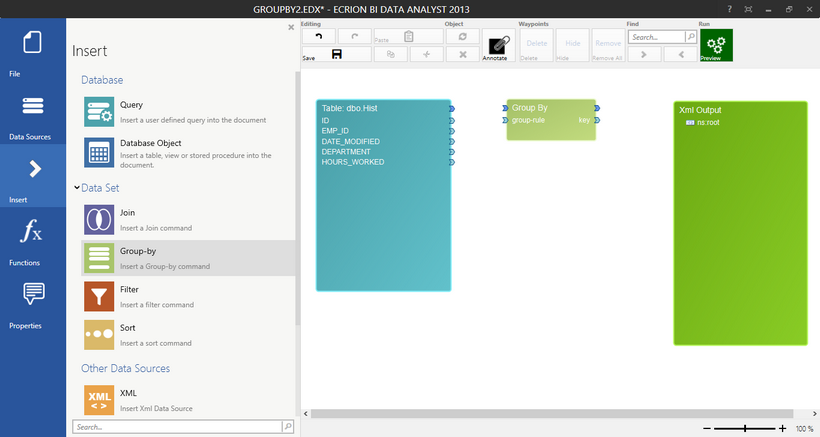
Figure 3: The Group By Command is added to the Data Diagram.
Insert Other Defining Objects
In this example, we are in need summing all of the hours for when the key is equal to the department value. Because of this requirement, we will need to insert some other valuable Diagram Objects available to us. Our first step will require us to add a filter for our sum function that ensures the Group By Key is equal the Department field. To do so, we will insert a Filter, an equals function, and a sum function. The equals function will be used to drive the filter object, and the result will be used to sum the field of our choosing. You should be aware that in this step, we are only adding the components that we know we must work with. We will complete the data mapping in future step. It is recommended that these Diagram Objects are visually aligned so you can create Data Connections without overlap if possible.
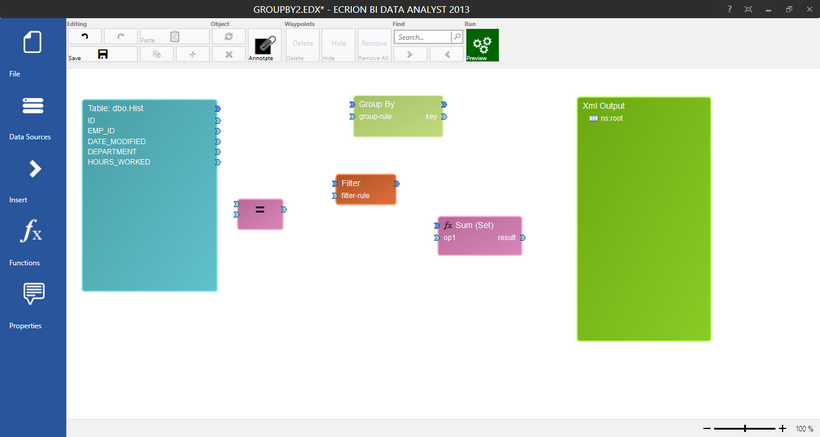
Figure 4: Other dependent Objects are added into the Data Diagram
Use Data Connections to Map Your Data Flow
Now that you have structured your Diagram Objects in the Design Surface, it is time to map your data flow using Data Connections. You can learn more about mapping data by connecting these arrows in the Using Data Connections section of the documentation. Below, we highlight the Data Connections that are created to map the flow of data.
| • | Connect our dbo.Hist table data set blue arrow to the Group By blue arrow. |
| • | Connect the Department field arrow to the group-rule arrow. This specifies the Department field to be the group rule. |
| • | Connect the Group By output blue arrow to our output XML node ns:root. This will create an element sequence. |
| • | Connect the Group By Key to our element sequence which will create an attribute to display our group key. |
| • | Connect the dbo.Hist table data set blue arrow to the Filter Set blue arrow. |
| • | Connect the Group By Key as the first input parameter in our equals function. |
| • | Connect the Department field as the second input parameter in our equals function. |
| • | Connect the Equals function result to the filter-rule parameter in the Filter function. |
| • | Connect the Filter Rule output arrow to the Sum(Set) function input blue arrow. |
| • | Connect the Hours_Worked field to the input parameter to the Sum(Set) function specifying that these values will be aggregated. |
| • | Connect the output Result of the Sum(Set) function to the element sequence in the output source. |
The product of establishing these Data Connection connections will be a Data Diagram with completed data mapping as shown in Figure 5.
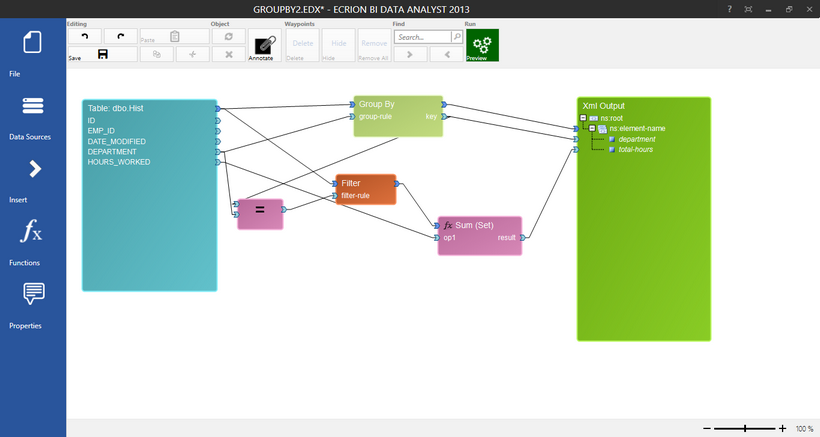
Figure 5: Data Connections are added to the Data Diagram to complete Data Mapping.
Results
It is recommended that once you have completed the structuring of your Data Diagram you proceed with previewing your Results to ensure the diagram is processing your data as intended. To do so, you can select Preview in the Toolbar. For our example, we can view that the resulting data groups our data for every department and displays the sum of all hours within each department.
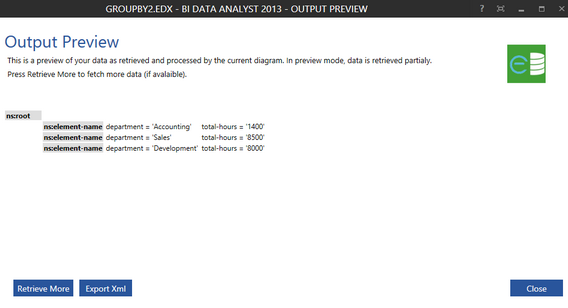
Figure 6: The results of the Data Diagram are displayed in the Output Preview Screen.