|
General Usage of Insert Chart Dialog |


|
|
General Usage of Insert Chart Dialog |
|
1. Select the Chart button located in the Insert Tab in the Ribbon. Select the Chart Type and Style you would like to work with from the drop down menu.
2. Once you have made your selections for Type and Style, you will now need to proceed with your Series Configuration. Depending upon the type of chart you have selected, this menu can change.
Pie charts, for example, are based on one series, where bar charts can accept multiple series. The general process involves using the Select buttons to choose your data points parent element, category access, and value access.
The Data Points selection is asking you to specify exactly where your data points will be located in your data.
The Caption refers to the label associated with each data point.
The Value represents the actual value used to drive the chart.
You can learn more about configuring charts one or more series by visiting the Creating a Chart With One Series and Creating a Chart With Multiple Series sections of the documentation.
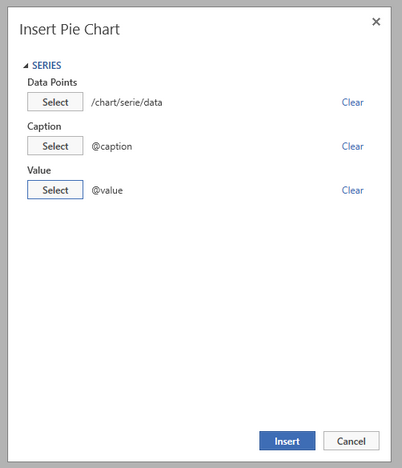
Figure 1: The Series is configured by selecting data points from the data source.
3. When you choose the Select button for each configuration point, the Dynamic Value Dialog will be launched. You will need to use the Data Tree to select your desired data point for each or select Create Expression to create a more complex XPath Expression manually.
4. When you have completed the steps above to define the chart, select Insert and the chart will be added into the Design Surface. You will also notice that a contextual tab for the chart is now present in the Ribbon. You can learn more about available options by visiting the Chart Options section.
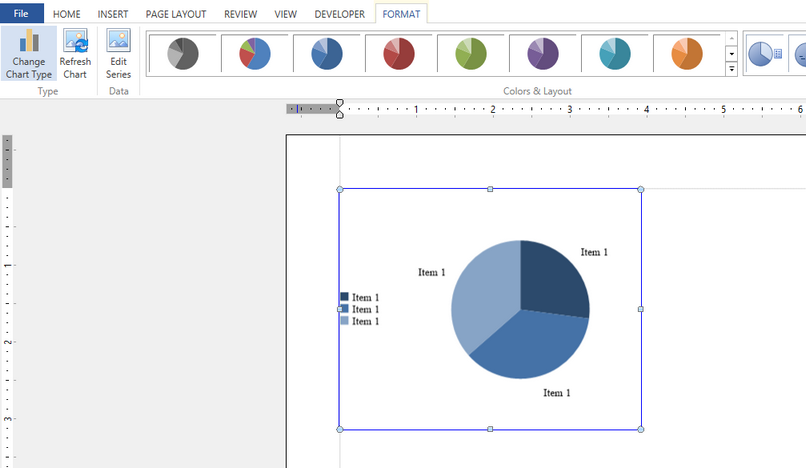
Figure 2: The chart is inserted into the Design Surface and a contextual Format tab for the chart is in the Ribbon when the chart is selected.