|
Creating a Pie Chart With One Series |


|
|
Creating a Pie Chart With One Series |
|
Charts such as Pie Charts and Doughnut Charts are based upon one data series. This example will assist you with inserting a basic Pie Chart based upon a single data series.
1. The first thing you should do is review your data source to determine where your data resides. In our example, there is a repeating series each containing investment data for three months. For this chart, we only want to present the data for one of these series, the month of "April".
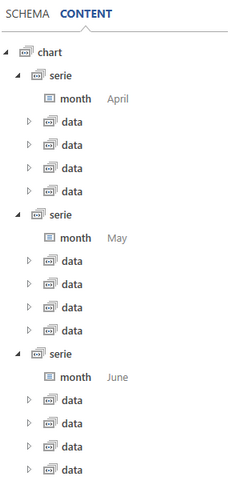
Figure 1: The data is investigated to determine where the data points reside.
2. Select the Chart button from the Inset Tab in the Ribbon and select the Pie Chart, then choose the Style of your preference.
3. Choose the Select button for data points to configure where the data points reside. This will launch the Dynamic Value Dialog. You can simply select the element in the Data Tree to specify where the data points reside, or you can select Create Expression to create your own XPath Expression.
For our example, we need to use a filter to get the data from the series with the attribute value is "April", so we will select Create Expression. Notice in our expression in Figure 3 the filter is used in square brackets stating to only select the Serie element where the "month" attribute is equal to "April".
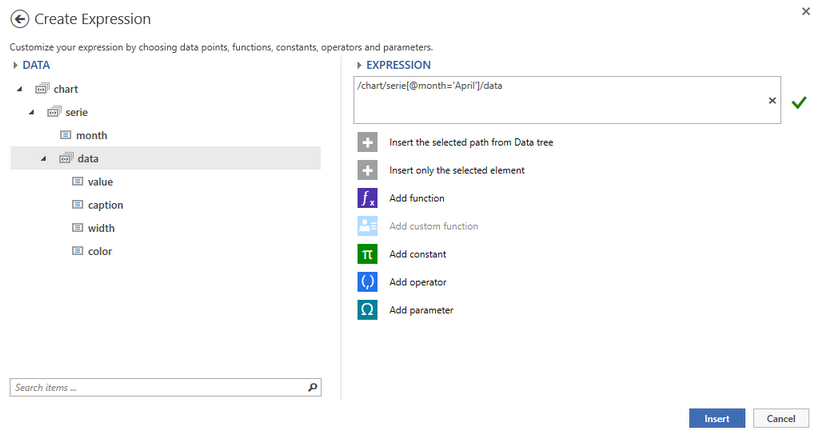
Figure 2: The expression is created to obtain specific data points.
4. Select Insert to return to the Insert Pie Chart Dialog. You will notice that your selection is now displayed. You can choose clear to remove or the Select button to return and make edits to your expression.
5. Repeat steps 3 and 4 for both the Caption and Value Series values. When you have completed this process of selection, each data point will be presented to you in the Insert Pie Chart Dialog.
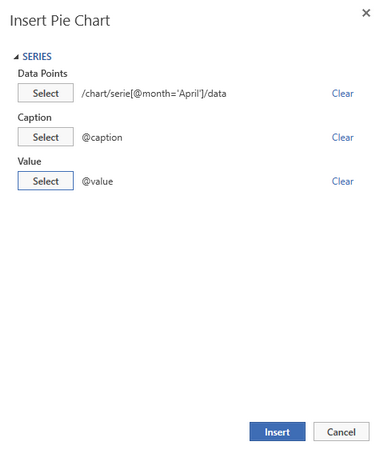
Figure 3: Each selected data point is listed in the Insert Pie Chart Dialog.
6. When you are satisfied with your specifications, select Insert and the chart will be inserted into the Design Surface. Notice how the captions that are retrieved are displayed outside of each pie slice as well as in a legend by default.
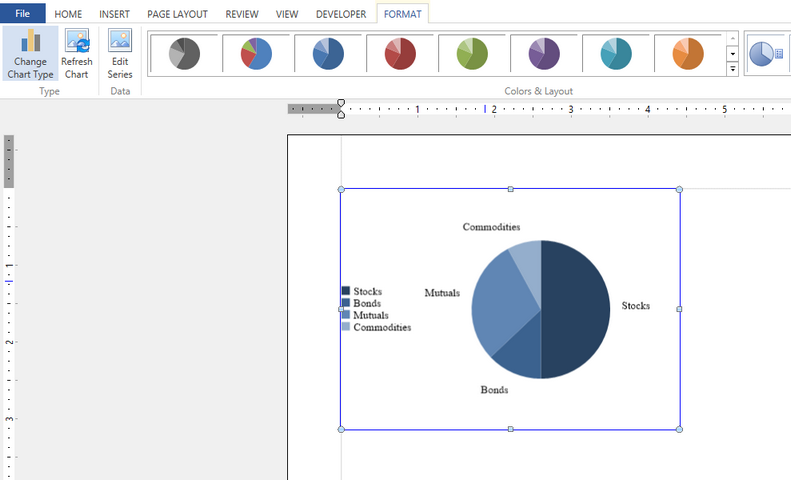
Figure 4: The chart is inserted into the Design Surface.
7. You can learn more about additional chart options by visiting the Chart Options section of the documentation.