|
Performing Advanced Analysis |


|
Advanced Analysis is an available feature of the BI Architect that will allow you to cluster your data based upon dimensions that you can define. Such clustering is useful when you might want to segment your data to investigate trends and locate which data values are falling into a certain cluster and why.
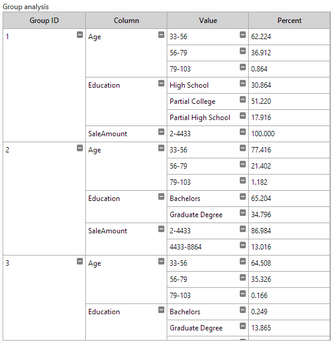
Figure 1: A Pivot Table showing an analysis used with 3 clusters.
The example in Figure 1 is an Pivot Table using an Analysis that is set up to investigate the market segmentation of a customer base. Let's first investigate why you would set this up.
What does this tell us?
Such a segmentation of our data can tell us important information such as:
1. What percentage of our lower sale customers have a high school education? Notice that cluster 1 tells us that 30.864% of our defined lower sales cluster has a high school diploma. This is in comparison to cluster two which has paired college experience as well as higher sales amounts.
2. What is the target age group for our lower spending customers? Notice that cluster 1 tells us that highest percentage of cluster one customers (lower sales customers) is ages 33-56.
1. First, you will need to set up an Analysis. To do so, select Analysis tab in the ribbon.
2. You can select New Analysis to launch the New Analysis Screen.
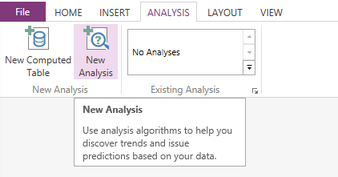
Figure 2: The New Analysis button highlighted in the ribbon.
3. Here you will now need to select Find clusters in your data and choose Continue.
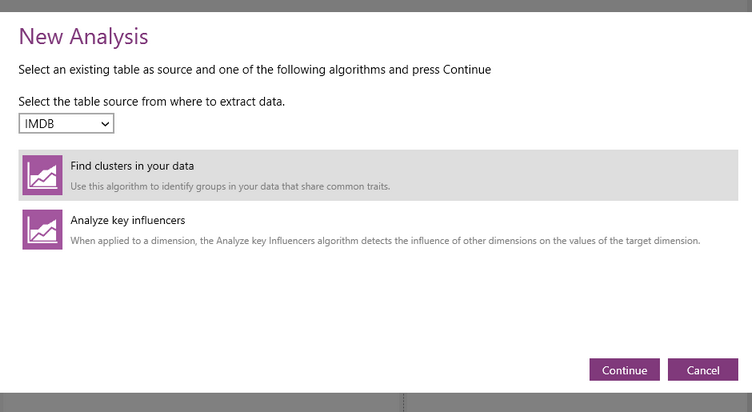
Figure 3: The Find clusters in your data button in highlighted in the New Analysis window.
4. This will launch the New Analysis Screen where you can specify which dimensions and measures you will use to define your clusters.
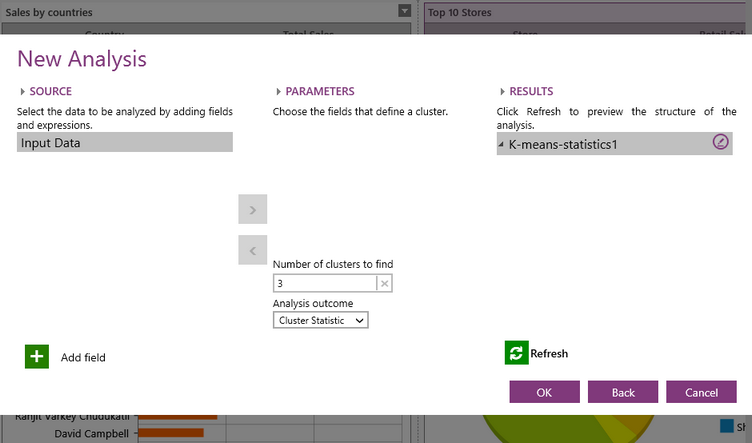
Figure 4: The New Analysis screen before anything is set up.
5. Select Add Field button to add a field from the Source group.
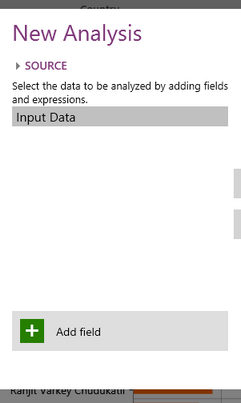
Figure 5: The add field button is highlighted in the Source section.
6. Now you can select the Field and change the Label to be used accordingly.
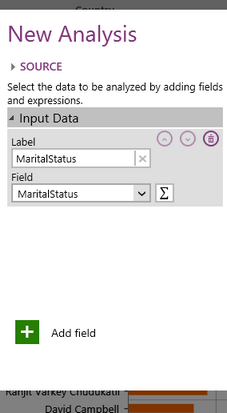
Figure 6: The field MaritalStatus as been selected.
7. You can repeat this process add the fields you would like to include.
8. Select from your fields by using the arrows to use for the grouping parameters of your cluster.
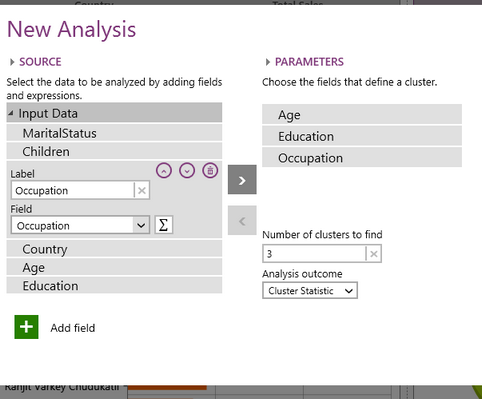
Figure 7: The fields Age, Education, and Occupation were selected.
9. In the Results section you can change the name of the Analysis by selecting Edit or select Refresh to view the preview the structure of your analysis
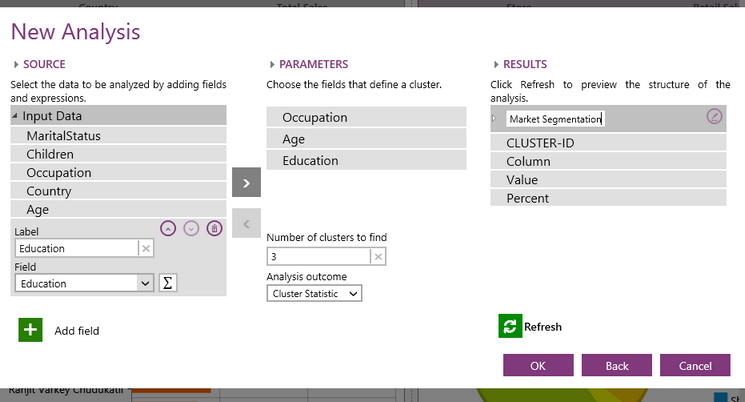
Figure 8: The Analysis has been renamed and a preview of the structure is shown.
10. When you are satisfied with your configuration, select OK.
Using An Analysis in a Widget
To use your configured analysis in a Widget, you can simply select to use data resulting from an existing analysis as provided by the Insert Dialogs for each Widget. This option will provide a drop down menu of existing Analysis that you can choose from. The example below highlights this option as provided by the Insert Table dialog.
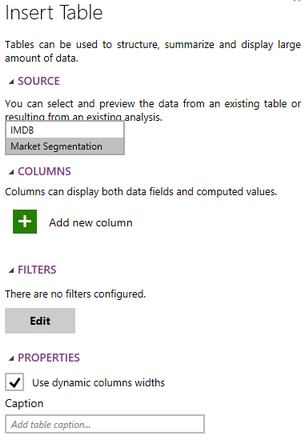
Figure 9: Selecting an existing Analysis when inserting a Widget.