|
Insert Gauge |


|
Gauges are useful to visually represent numerical values in your dashboard which are driven by the filters you have inserted.
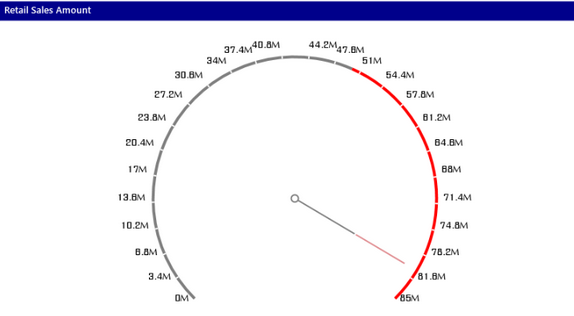
Figure 1: This gauge is a visual representation of the Retail Sale Amount from 0 - 85 million US dollars.
Access:
To learn how to access the Insert Gauge dialog please visit the helpful page on Inserting Visualization Widgets for the specific display mode you are using, Mouse or Touch.
Usage
To set up a gauge as reflected in Figure 1, the following configuration steps were used:
1. From the insert gauge dialog the circular gauge was selected
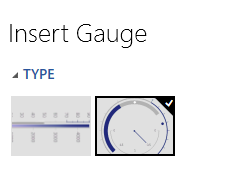
Figure 2: The Circular Gauge is highlighted in the Type option.
2. The Source table was selected to be Sales. The source table is the table you wish to pull the data from.

Figure 3: The Source table can be changed by selecting the arrow to the right of the field.
3. The Value was set to be the sum of the Retail Sales Amount. The Value you will select should be the value you want your gauge to represent.

Figure 4: The value can be set in the Data option in the Insert Gauge dialog.
Note: You can change function from sum to any of the available options by selecting the button to the right of the Value field.
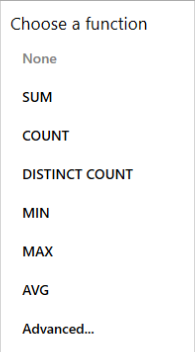
Figure 5: A list of predefined functions are available by selecting the button to the right of the Value field.
4. The Range was set to be 0 - 85 million US dollars. It is important to think about the range of the value you are trying to represent; you can set a min and max range to show the entire range of your data, or you can specify a range to show.
5. The number of Major Ticks was set to 25. Major Ticks refer to how many data points will be shown on the gauge.
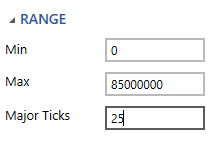
Figure 6: The Major Ticks are specified in the Range section.
6. A Segment was set to highlight the Retail Sales values greater than 50 million. Segments can be used to mark meaningful ranges on your gauge.
Note: You can set as many segments as you need, or you can leave them out all together.
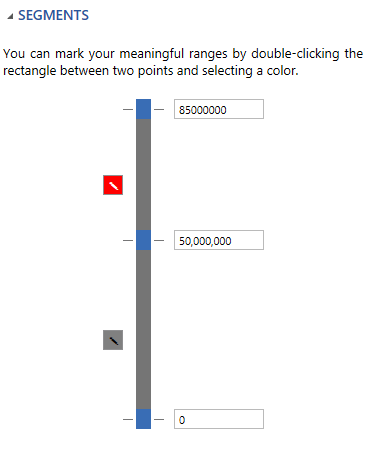
Figure 6: The segment is set to 50 million, and the color was changed to red.
Note: Along with the gauge you will need to insert a filter into your dashboard to drive the gauge. You can learn more about the different types of filters and how it insert them here.
Related Topics
You may also be interested in the following topics.
Widget Marking - It is important to think about your final dashboard throughout the entire design process. Link widgets through powerful coloring and filter displays in your dashboards using marking.
Aligning and Resizing Dashboard Objects - Lean about organizing and resizing your dashboard objects.
Inserting a Gauge - You can view this helpful video on how to configure and insert a gauge, as well as how to edit the gauge using the Properties Pane.
Tutorial
Inserting a Gauge - In this tutorial video you will learn how to configure and insert a gauge, as well as how to edit the gauge using the Properties Pane.