|
DAX Sub-Diagram |


|
|
DAX Sub-Diagram |
|
If you have already designed a Data Diagram in the BI Data Analyst, you can also choose to include that in your current Data Diagram as another data source. This diagram within a diagram option allows you to link up many different sub-diagrams as you see fit. As an example, we'll take the following Data Diagram and insert it as a data source.
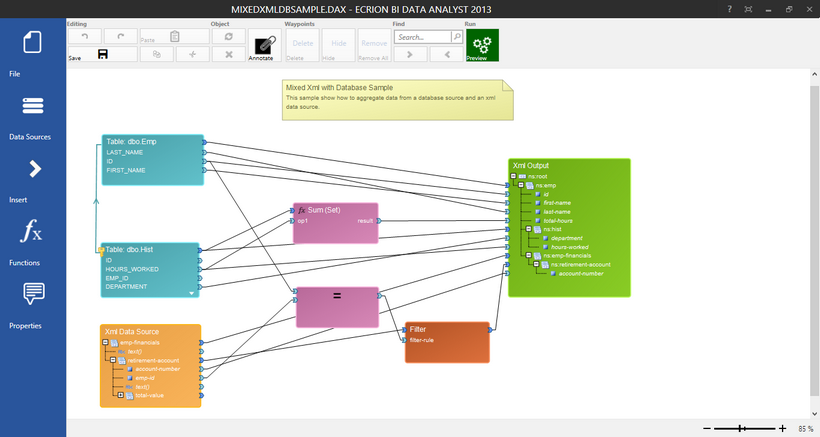
Figure 1: A Sample Data Diagram to be used as a data source.
This Data Diagram uses both database Tables and an XML File as data sources. You can notice the structure of the XML Output. This output will be available to you when for data mapping once inserted into your parent Data Diagram.
Usage
By selecting Insert in the Side Menu you can access the Insert DAX Sub-Diagram option from the Other Data Sources group. By selecting this option, you will be given access to the Insert DAX Data Source dialog. Here you can select Browse to navigate and select your DAX Sub-Diagram. In this step, we will find the example in Figure 1.
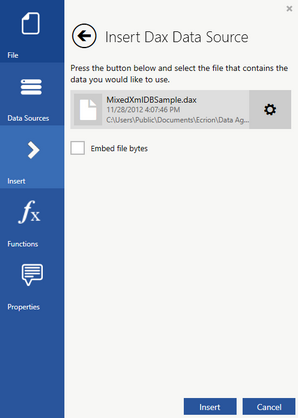
Figure 2: The DAX Sub-Diagram is selected.
Once the appropriate file is selected, select Insert to add the DAX Sub-Diagram into your Data Diagram. In this example, you can notice the output XML as shown in Figure 1. This sub-diagram will be displayed in blue, and you can continue with data mapping to connect this input source to your desired output data source. As demonstrated in Figure 3, we have used this sub-diagram to retrieve desired data and also inserted another database Table to obtain more data from a different database.
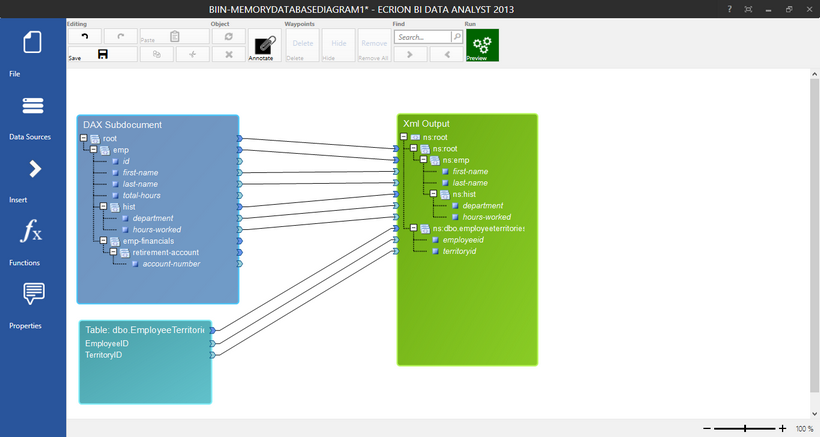
Figure 3: The final Data Diagram uses both a DAX Sub-Diagram and a Database Object to produce the desired XML Output.