|
Resizing Your Chart |


|
|
Resizing Your Chart |
|
1. You can resize your chart simply by dragging and dropping in the design surface. Begin by selecting the chart in the Design Surface.
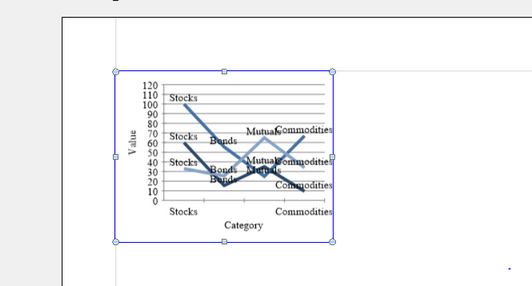
Figure 1: The Chart is selected in the Design Surface.
2. Drag and drop any of the corner or side selection points to achieve a new desired size. Release the mouse when you are content with the new size outline.
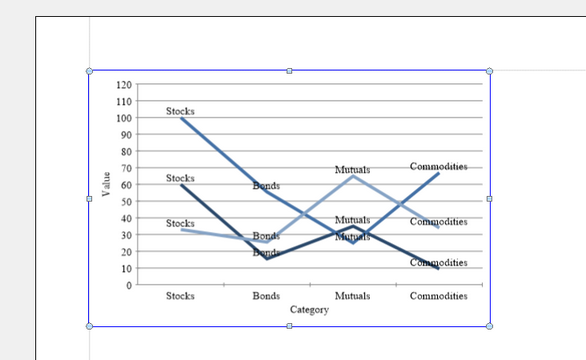
Figure 2: The chart is resized by dragging and dropping.
3. To apply more specific chart dimensions, double click on the chart in the Design Surface to launch the Properties Pane.
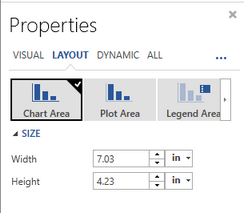
Figure 3: The Layout Menu of the Properties Pane allows for specific chart resizing.
4. In the Properties Pane, select the Layout Menu at the top. Then choose the area you would like to resize. You can resize individual areas such as the legend, plot area, or the entire chart as you see fit. Begin by selecting the measurement unit and then manually typing in the value of the Width and Height for the object you wish to modify. Upon applying, you will notice your adjustments being reflected in the Design Surface.