|
Warning Triangle |


|
The Warning Triangle is used to see the evolution of an element between some thresholds you define.
1. Navigate to the Insert tab in the ribbon.

Figure 1: The Insert tab in the ribbon.
2. Select the Custom Widget button from the Visualization group.
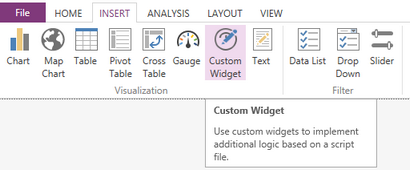
Figure 2: The Custom Widget button highlighted in the Insert tab.
3. In the Insert Custom Widget dialog select the browse button.
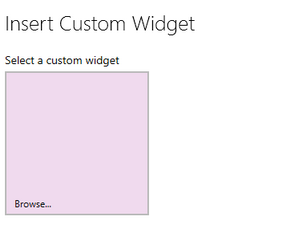
Figure 3: The browse button is highlighted.
4. Select the Warning Triangle widget.
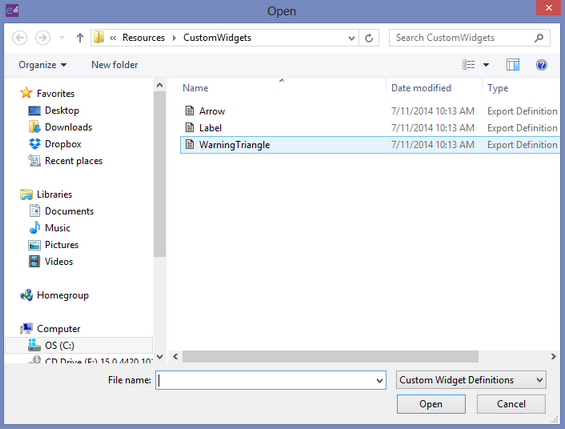
Figure 4: The warning triangle widget is highlighted.
5. Select the field to be used for the input expression.
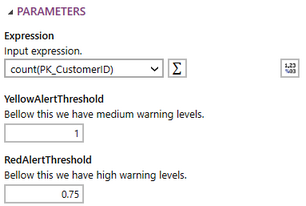
Figure 5: The count of the customer ID is selected.
6. If needed change the function of the Reference Value by selecting the summation button.
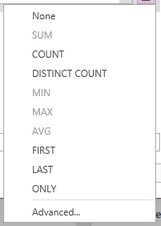
Figure 6: The list of available function types.
7. If needed you can select the format button and choose one of the formats available or create your own.
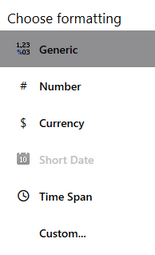
Figure 7: The list of formatting options.
8. Add a value for the medium warning level of the triangle.
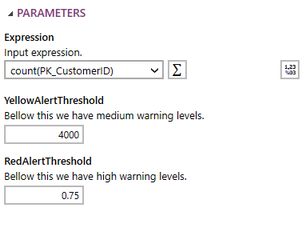
Figure 8: A medium value of 4000 customers was created.
9. Add a value for the high warning level of the triangle.
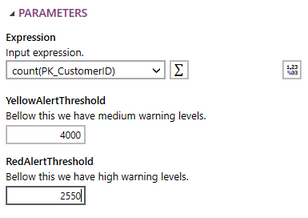
Figure 9: A high value of 2250 customers was created.
10. Once you have set the expression, you may need to apply a local filter to your data. Visit this helpful page to learn more about applying a local filter.
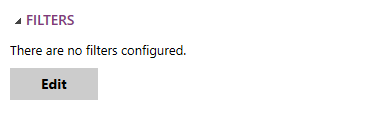
Figure 10: The edit filter button in the Insert Chart Dialog.
11. Once you have set up your widget select insert and the warning triangle will be added to the design surface.
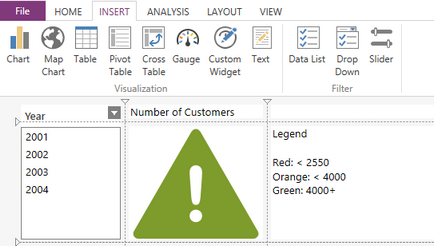
Figure 11: The resulting widget in the design surface.
In Figures 12-14 below you will see how the widget behaves when using the filter.
|
|
|
Figure 12: The triangle is red for year 2001. |
Figure 13: The triangle is orange for year 2002. |
Figure 14: The triangle is green for year 2003. |