|
How to Insert a Cross Table |


|
Cross tables are powerful table structures to investigate the correlation trends among data points as well as providing a visual manner to compare data side by side.
1. Navigate to the Insert Tab in the ribbon.

Figure 1: The Insert tab in the ribbon.
2. Select the Cross Table button from the Visualization group.
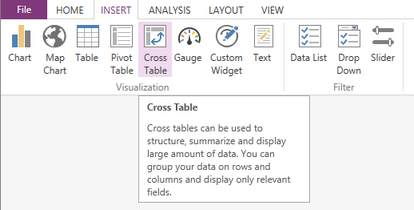
Figure 2: The Cross table button highlighted in the Insert tab.
As you have connected to an In-Memory Data Base, this will be the only option for the Source.
3. Select the Add row group button to add a new grouped row. When added, a row group will vertically group the selected field.
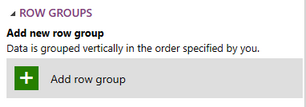
Figure 3: The add row group button is highlighted in the Cross Table dialog.
4. From the drop down list select the field you would like to populate this row.
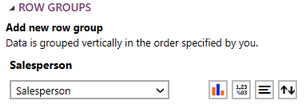
Figure 4: The field salesperson was selected for the row group.
5. To learn more about the configuration options for each row visit Row and Column Group Options.
6. Repeat the above steps (3 - 5) until you have added and configured all of the row groups you need for your Cross Table.
7. To insert a new column group select the Add column group button. When added a column group will horizontally group the data from the selected field.
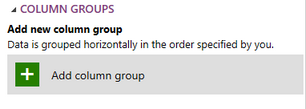
Figure 5: The add column group highlighted in the Cross Table dialog.
8. From the drop down list select the field you would like to populate this column.
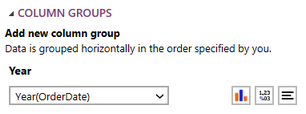
Figure 6: The field Year was selected for the column group.
9. To learn more about the configuration options for each column visit Row and Column Group Options.
10. Repeat the above steps (7-9) until you have added and configured all of the column groups you need for your Cross Table.
9. Select the Add table value button to add a new value. The table value should be the value or values that you wish your table to compare.
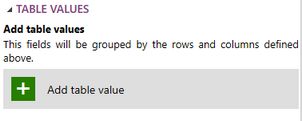
Figure 7: The add table value option highlighted in the Cross Table dialog.
10. From the drop down list select the field that you would like to compare.
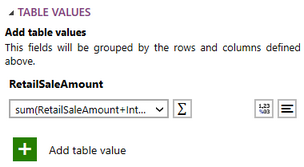
Figure 8: The sum of the retail and internet sales amount is used for the table value.
11. To learn more about the options to configure for each table value visit Table Value Options.
12. Once you have configured all of your series all of your Chart, you may need to apply a local filter to your data. Visit this helpful page to learn more about applying a local filter.
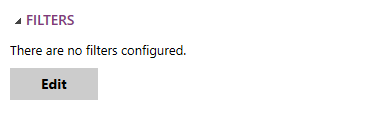
Figure 9: The edit filter button in the Insert Table Dialog.
13. You are able to enter a Caption for the Chart in the Properties section if needed.

Figure 10: A caption was added to the table.
14. Once you have added and configured all of rows,columns,and values needed for your Cross Table select Insert and you will see the table inserted in the design surface.
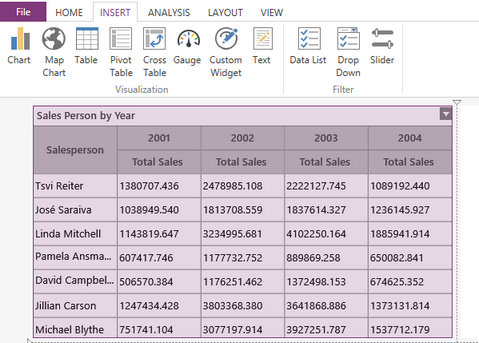
Figure 11: The resulting Cross Table in the design surface.
Next Steps
Cross Table Properties - Learn about how to edit and customize your chart after inserting it into the design surface.
Include or Exclude Widgets - Learn how to exclude widgets from your dashboard without deleting it all together.
Resizing Widgets - Learn how to resize your widgets in the design surface.
Repositioning Widgets - Lean how to reposition your widgets after inserting into the design surface.