|
Configuring Widgets |


|
The new dashboard Wizard provides step four Configure Elements (widgets) in your dashboard. Widgets are UI (User Interface) elements that are used in your dashboard to display your enterprise data. The BI Architect provides the following list of choices for you to choose from. At step four, the layout you have selected may contain one or more of the following.
| • | Chart widgets |
| • | Table widgets |
| • | Pivot Table widgets |
| • | Cross Table widgets |
| • | Text Widgets |
Usage
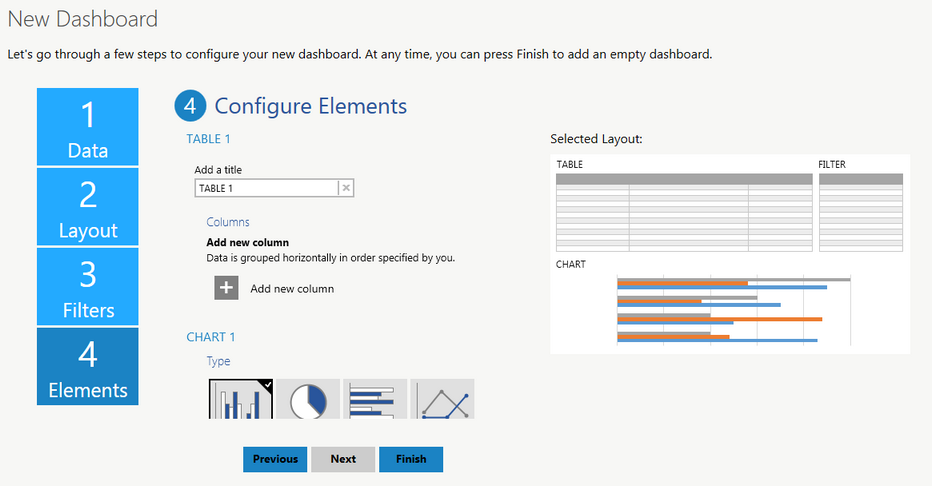
The Wizard will now display the Configure Elements screen. This screen will walk you through, step by step, configuring each widget in your dashboard. In this example, configuration is needed for both the Table and Chart widgets. Here you will notice our first item to configure is the Table widget.

Figure 1: Configure the visualization widgets present in the dashboard using the Wizard.
Depending upon the layout you have selected, you will need to configure each visualization widget in your dashboard. It is recommended that for each widget configuration, you read more about Working With Widgets. You can see below the simple steps involved in configuring the example above:
Table Configuration
You may want to begin by adding a title to your table. Simply add your text in the field provided in the Caption field. Next, add a column to your table by selecting Add new column. Here you can specify the dimension you would like to be represented in this table. You also are able to edit the title of the column by selecting the rename button. In this example, there is a column for Retail Sales Amount and a column for Country. Visit Insert Table for more information on these configuration steps.

Figure 2: Configuring the table widget.
Chart Configuration
In the Configure Elements window you can scroll down to access further configuration options. You will now need to configure the chart widget present in the dashboard. Here you can use the wizard to select the chart Type, Style, and set up the Series to be used in your chart widget. Simply select the options applicable to your needs, and proceed with configuring each Series by selecting Category and Value axis choices. In this example, a series is set up to display total Retail Sales and total Internet Sales per Country in a 3D Horizontal Bar Chart. Visit Insert Chart for more information on these configuration steps.
|
|
Figure 3: Select the chart Type and Style. |
Figure 4 Configuring the chart widget. |
When you have completed configuring the elements present in your dashboard, select Finish. This step will complete the usage of the Wizard, and now display your dashboard preview in the Design Surface. You can now add, remove, or configure your widgets at any time using Side Menu or Ribbon options.
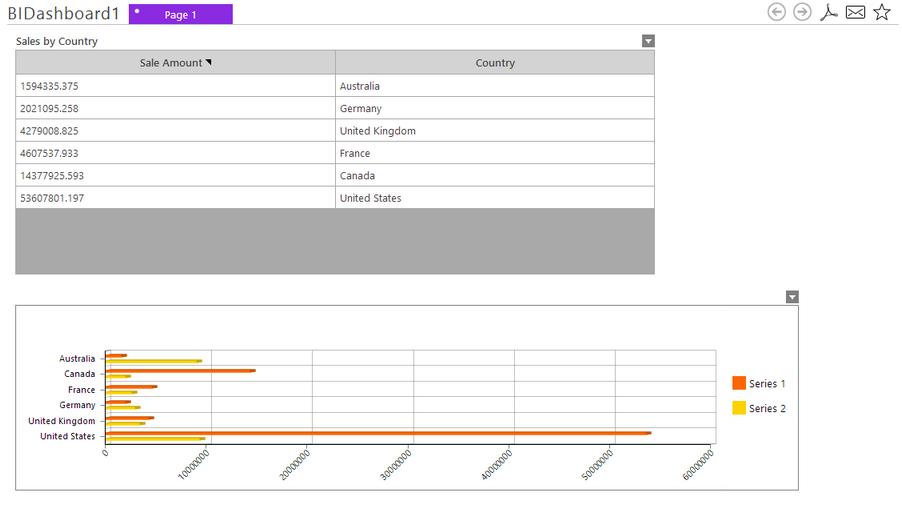
Below is an example of the completed dashboard used in this example in both the dashboard design view and in preview.
Figure 4: Completed dashboard in dashboard design view |

Figure 5: Completed dashboard in preview mode with filters applied