|
Graphics |


|
|
Graphics |
|
XSL-FO provides the means to display images and vectorial graphics through two elements: fo:instream-foreign-object when the content is embedded in the XSL-FO document and fo:external-graphic when the image resides in an external file.
| ► | SVG |
One of the supported formats for fo:instream-foreign-object is SVG (Scalable Vector Graphics).
Example of usage:
<?xml version="1.0" encoding="utf-8" ?>
<fo:root xmlns:fo="http://www.w3.org/1999/XSL/Format">
<fo:layout-master-set>
<fo:simple-page-master master-name="LetterPage" page-width="4in" page-height="3in">
<fo:region-body region-name="PageBody" margin="0.1in"/>
</fo:simple-page-master>
</fo:layout-master-set>
<fo:page-sequence master-reference="LetterPage">
<fo:flow flow-name="PageBody">
<fo:block font-family="Arial" font-size="10pt" font-weight="bold">
SVG Graphics Example
</fo:block>
<fo:block>
<fo:instream-foreign-object content-height="2.2in"> (1)
<svg xmlns="http://www.w3.org/2000/svg" width="480" height="280">
<linearGradient id="Grad1"gradientUnits="objectBoundingBox" x1="0" y1="0" x2="1" y2="1"> (2)
<stop stop-color="rgb(238,130,238)" offset="0"/>
<stop stop-color="blue" offset="0.2"/>
<stop stop-color="lime" offset="0.4"/>
<stop stop-color="yellow" offset="0.6"/>
<stop stop-color="rgb(255,165,0)" offset="0.8"/>
<stop stop-color="red" offset="1"/>
</linearGradient>
<!-- Linear gradient on the stroke of a rectangle -->
<rect x="20"y="20" width="440" height="80" fill="url(#Grad1)"/>
<text font-family="Arial" font-size="14" x="20" y="130">
Multi-color linear gradient.
</text>
<!-- Radial gradient on the stroke of a rectangle -->
<radialGradient id="Grad2"gradientUnits="userSpaceOnUse" cx="240" cy="210" r="220" fx="240" y="210"> (3)
<stop stop-color="black" offset="0"/>
<stop stop-color="yellow" offset="0.2"/>
<stop stop-color="red" offset="0.4"/>
<stop stop-color="blue" offset="0.6"/>
<stop stop-color="white" offset="0.8"/>
<stop stop-color="green" offset="1"/>
</radialGradient>
<rect x="20" y="150" width="440" height="80" fill="url(#Grad2)" stroke-width="40"/>
<text font-family="Arial" font-size="14" x="20" y="260">
Multi-color radial gradient.
</text>
</svg>
</fo:instream-foreign-object>
</fo:block>
</fo:flow>
</fo:page-sequence>
</fo:root>
Output:
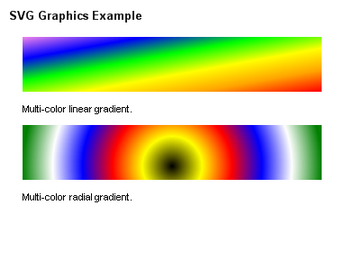
Key observations:
(1) fo:instream-foreign-object is used to wrap the SVG graphic.
(2)(3) Inside SVG, two rectangles are filled with gradients.
| ► | XChart |
In addition to SVG, XF Rendering Server supports XChart, an XML language developed by Ecrion Software for the purpose of describing generic charts.
Any XChart document has xc:root element, that is, the top node in an XChart document.
Typically, this element contains the declaration of 'XChart' namespace xmlns:xc="http://www.ecrion.com/xc". A document can range from an empty fragment (no content inside xc:root) to a complex, deeply nested collection of XChart, XSL-FO and SVG elements.
There can be produced Pie, Area, Bar, Spider, Scatter and Line Charts. It is also able to render combinations of these types.
Example of usage, that will display a 3D Pie XChart:
<xc:root width="5.49in" height="3.979in" theme="style21">
<xc:pie pie-shape="pie" labels-position="inclusive" aspect-3d-view="true" aspect-3d-chart-depth="15px" slice-orientation="clockwise" start-angle="270" height="3.875in" y="0.052in" width="5.386in" x="0.052in">(1)
<xc:slice caption-offset="15px" description="Serie 1" value="13.48" caption="13.48%"/>
<xc:slice caption-offset="15px" description="Serie 1" value="8.98" caption="8.89%"/>
<xc:slice caption-offset="15px" description="Serie 1" value="7.52" caption="7.52%"/>
<xc:slice caption-offset="15px" description="Serie 1" value="1.18" caption="1.18%"/>
<xc:slice caption-offset="15px" description="Serie 1" value="18.59" caption="18.59%"/>
<xc:slice caption-offset="15px" description="Serie 1" value="16.94" caption="16.94%"/>
<xc:slice caption-offset="15px" description="Serie 1" value="23.90" caption="23.90%"/>
<xc:slice caption-offset="15px" description="Serie 1" value="9.68" caption="9.68%"/>
</xc:pie>
</xc:root>
Output:
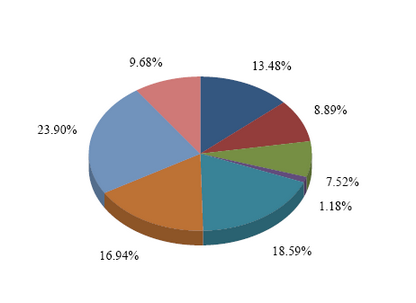
Key observation:
(1)aspect-3d-view attribute defines the 3D aspect
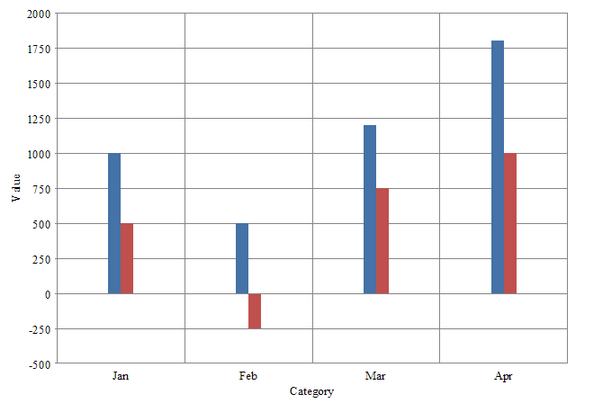
There can be produced different types of bar charts, from simple ones to group-stacked or group-clustered.
Example of usage for a group-cluster chart:
<xc:root width="6.708in" height="4.77in" theme="style21">
<xc:plot-area labels-position="inclusive" aspect-3d-view="false" x="10px" y="10px" width="623.968px" height="437.92px">
<xc:bar-chart bar-shape="bar" grouping="clustered">
<xc:serie>
<xc:data-point width="14px" description="Serie 1" value="1000" category="Jan"/>
<xc:data-point width="14px" description="Serie 1" value="500" category="Feb"/>
<xc:data-point width="14px" description="Serie 1" value="1200" category="Mar"/>
<xc:data-point width="14px" description="Serie 1" value="1800" category="Apr"/>
<xc:data-point width="14px" description="Serie 1" value="500" category="Jan"/>
<xc:data-point width="14px" description="Serie 1" value="-250" category="Feb"/>
<xc:data-point width="14px" description="Serie 1" value="750" category="Mar"/>
<xc:data-point width="14px" description="Serie 1" value="1000" category="Apr"/>
</xc:serie>
<xc:serie>
<xc:data-point width="14px" description="Serie 2" value="500" category="Jan"/>
<xc:data-point width="14px" description="Serie 2" value="-250" category="Feb"/>
<xc:data-point width="14px" description="Serie 2" value="750" category="Mar"/>
<xc:data-point width="14px" description="Serie 2" value="1000" category="Apr"/>
</xc:serie>
</xc:bar-chart>
<xc:value-axis orientation="vertical" caption-offset="5px" caption="Value" intersection="auto" unit="250">
<xc:tick-marks tick-mark-style="cross"/>
<xc:grid-lines/>
<xc:display-values placement="auto" fill="rgb(0,0,0)" format="####0.## th: dec:." offset="5pt" orientation="horizontal"/>
</xc:value-axis>
<xc:category-axis orientation="horizontal" caption-offset="5px" caption="Category">
<xc:tick-marks tick-mark-style="cross"/>
<xc:grid-lines/>
<xc:display-values placement="between" fill="rgb(0,0,0)" offset="5pt"/>
</xc:category-axis>
</xc:plot-area>
</xc:root>
Output:
| ► | External Graphics |
To display an image from an external file the fo:external-graphic attribute can be used.
All majors formats are supported, including BMP, JPEG, GIF, PNG, WMF, POSTSCRIPT, TIFF, etc. Unisys U.S. LZW Patent No. 4,558,302 used for GIF image compression expired on June 20, 2003, the counterpart patents in the United Kingdom, France, Germany and Italy expired on June 18, 2004, the Japanese counterpart patents expired on June 20, 2004 and the counterpart Canadian patent expired on July 7, 2004.
More information can be found on the Unisys Website.
Example of usage:
<?xml version="1.0" encoding="utf-8" ?>
<fo:root xmlns:fo="http://www.w3.org/1999/XSL/Format">
<fo:layout-master-set>
<fo:simple-page-master master-name="LetterPage" page-width="3in" page-height="1.2in">
<fo:region-body region-name="PageBody" margin="0.1in"/>
</fo:simple-page-master>
</fo:layout-master-set>
<fo:page-sequence master-reference="LetterPage">
<fo:flow flow-name="PageBody" font-family="Arial" font-size="10pt">
<fo:block font-weight="bold">
External Graphics Example
</fo:block>
<fo:block>
Text Before <fo:external-graphic src="ecrion-logo.png" content-height="0.7in" vertical-align="middle"/>
Text After
</fo:block>
</fo:flow>
</fo:page-sequence>
</fo:root>
Output:

Key observations:
| · | Image urls can be either absolute or relative. When relative, the location of the XSL-FO document is used to compute the full path to the image. The baseUrl property can be used to override this location. |
| · | Image can be scaled using the content-width and content-height properties. In this example only the desired height is specified and the width is computed automatically by the renderer, preserving the aspect ratio. |
| · | Inline graphics can be shifted vertically using the vertical-align attribute. |