|
Combining Charts |


|
|
Combining Charts |
|
Output:
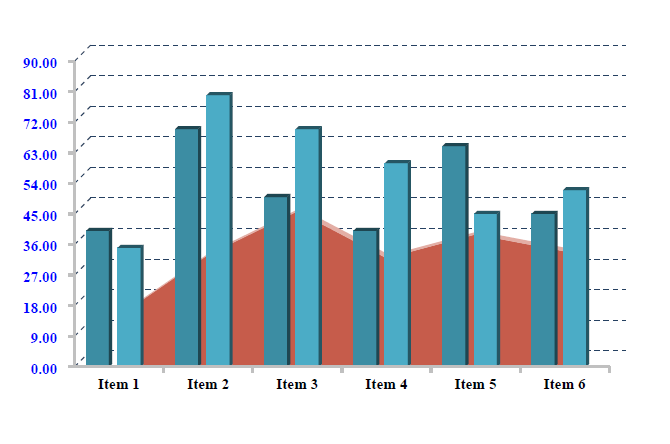
The code used to generate this chart is listed below. A 3D plot area containing both an area chart and a clustered bar chart is created.
<xc:root width="500pt" height="500pt" xmlns:xc="http://www.ecrion.com/2008/xc">
<xc:plot-area x="50pt" y="50pt" width="350pt" height="200pt" aspect-3d-view="true" aspect-3d-chart-depth="2pt">
<xc:area-chart>
<xc:serie fill="#C65C4B" stroke-width="2pt">
<xc:data-point width="20px" category="Item 1" value="15" />
<xc:data-point width="20px" category="Item 2" value="33" />
<xc:data-point width="20px" category="Item 3" value="45.8" />
<xc:data-point width="20px" category="Item 4" value="32" />
<xc:data-point width="20px" category="Item 5" value="39" />
<xc:data-point width="20px" category="Item 6" value="34" />
</xc:serie>
</xc:area-chart>
<xc:bar-chart grouping="clustered" cluster-spacing="15px">
<xc:serie fill="#3C8DA3">
<xc:data-point width="20px" category="Item 1" value="40" />
<xc:data-point width="20px" category="Item 2" value="70" />
<xc:data-point width="20px" category="Item 3" value="50" />
<xc:data-point width="20px" category="Item 4" value="40" />
<xc:data-point width="20px" category="Item 5" value="65" />
<xc:data-point width="20px" category="Item 6" value="45" />
</xc:serie>
<xc:serie fill="#4BACC6">
<xc:data-point width="20px" category="Item 1" value="35"/>
<xc:data-point width="20px" category="Item 2" value="80" />
<xc:data-point width="20px" category="Item 3" value="70" />
<xc:data-point width="20px" category="Item 4" value="60" />
<xc:data-point width="20px" category="Item 5" value="45" />
<xc:data-point width="20px" category="Item 6" value="52" />
</xc:serie>
</xc:bar-chart>
<xc:category-axis stroke="silver" stroke-width="2px" font-size="20pt" caption-color="red">
<xc:tick-marks tick-mark-style="outside" stroke-width="2px" stroke="silver"/>
<xc:grid-lines stroke="#254061" stroke-width="1px" stroke-dasharray="4px 4px"/>
<xc:display-values fill="black" offset="7px" placement="between" font-weight="bold"/>
</xc:category-axis>
<xc:value-axis stroke="silver" stroke-width="2px" font-size="20pt">
<xc:tick-marks tick-mark-style="outside" stroke-width="2px" stroke="silver"/>
<xc:grid-lines stroke="#254061" stroke-width="1px" stroke-dasharray="4px 4px" />
<xc:display-values fill="blue" offset="15px" font-weight="bold" format="####0.00 th: dec:."/>
</xc:value-axis>
</xc:plot-area>
</xc:root>