|
Use functions on grouped data |


|
Overview:
To make a point over some information or to make the information easier to understand, the data presented in tables must be grouped considering different criteria.
Also, different operations must be applied to the data, like summing, multiplying etc.
Solution:
For a better understanding on how XF Designer can perform different operations on grouped data, an example where the count and sum function are used is provided below.
1. The basic grouping options must be set as presented in the Group dynamic data in tables tutorial, but instead of a row with 2 columns a row with 3 columns must be inserted. Also, the last row must not be deleted.
The table should look like the following:

2. The cursor must be placed in the last row and the Merge button located in the Groups group under Layout tab must be selected. The last row has now an attribute applied, referring the parent group set before (the xfd:parent-group attribute is inserted in Text View).
3. In the last row's second cell a field with the following expression must be inserted: "count(../ns:cd[@country=current()/@country]/@title)". The count function will return the number of CD's, by counting the number of titles.
This expression translates to: count all the titles from ns:catalog/ns:cd, where @country attribute is equal to the current @country attribute.
To insert the field, the Field button located in the Dynamic Content group under the Insert tab must be selected.
4. In the last row's third cell a field with the following expression must be inserted: "sum(../ns:cd[@country=current()/@country]/@price)", in order to sum the prices.
5. To select the sum number's format, the "sum" field must be right-clicked and the Format option chosen. The Format Field dialog is displayed, from where a custom formatting style with 2 decimals can be selected.
6. The table will look like the following in Design View:

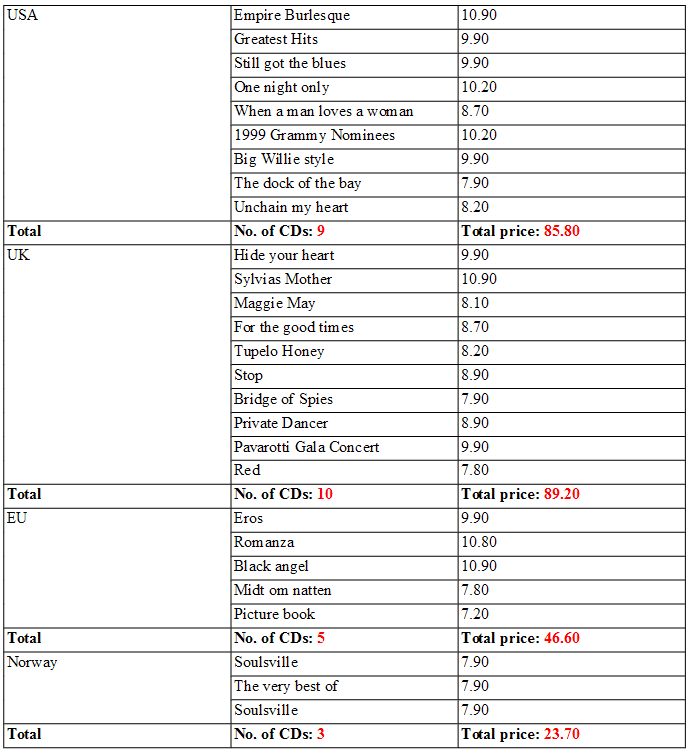
The output table will be the following:

To display only the total values for each country, the steps associated with the table-row-repeat settings must be skipped and the table should be inserted as described below:
1. A table with 1 row and 3 columns must be inserted.
2. The first cell must be selected a Group Above inserted. (with same grouping options as described in the tutorial)
3. In the first cell of the first row the "@country" field must be dragged and dropped from the XML data source and the row span increased.
4. The second cell from the second row must be selected and a field with the count expression described above inserted.
5. The third cell from the second row must be selected and a field with the sum expression as described above inserted. (also the number format must be set to 2 decimals)
6. The table will look like the following:
