|
Edit Axis |


|
|
Edit Axis |
|
Overview: Charts allow in-detail configuration of both the Category and Value axis.
Accessing: To display the Edit Value Axis and Edit Category Axis dialogs, the Value Axis or Category Axis options must be chosen from the drop-down list corresponding to the Axis button located in the Data group under the Format tab.
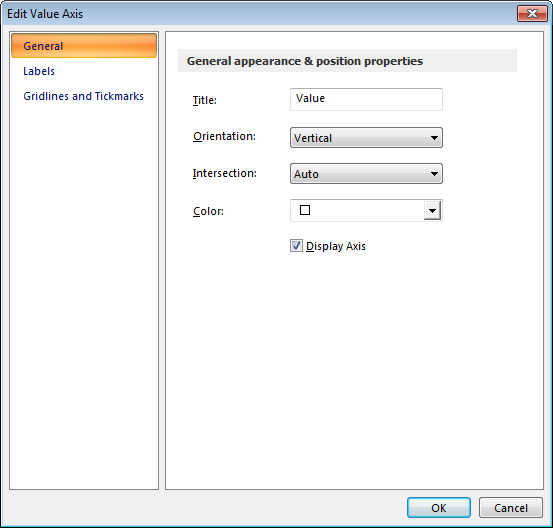
Edit value axis
Edit Value Axis dialog has 3 sections: General, Labels, Gridlines and Tickmarks.
General: displays options related to the axis title, orientation, intersection, color, unit frequency, min and max values.
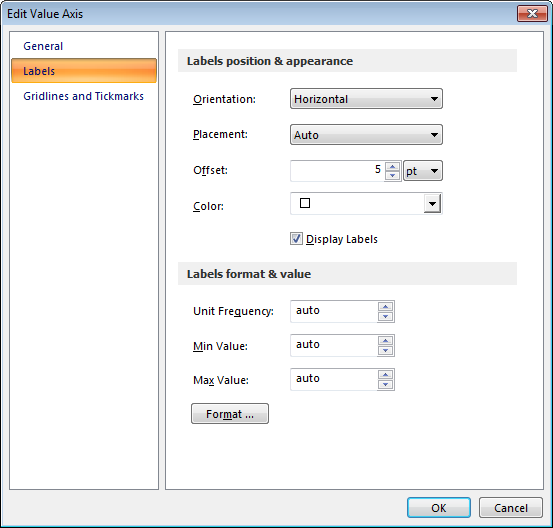
Labels: this section allows customization of label related attributes such as orientation, color, unit frequency etc.
Gridlines and Tickmarks: style for tickmarks and colors for both gridlines and tickmarks can be customized in this section.

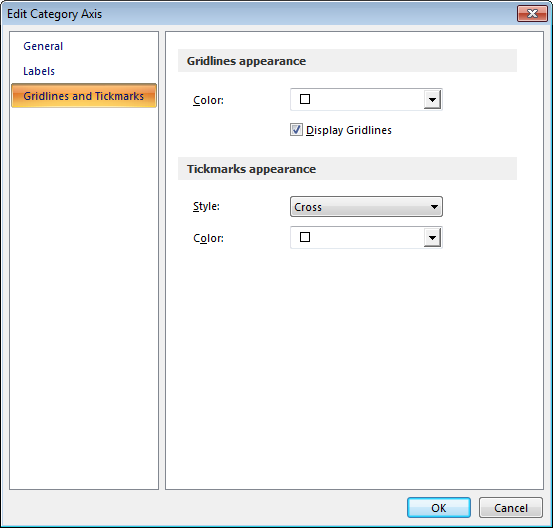
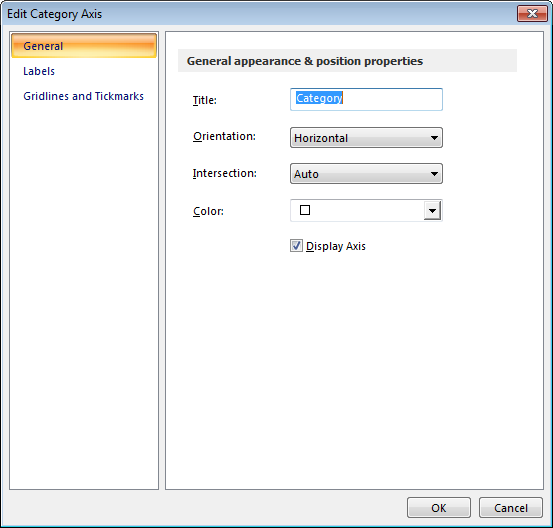
Edit Category Axis
Edit Value Axis dialog has 3 sections: General, Labels, Gridlines and Tickmarks.
General: displays options related to the axis title, orientation, intersection, color, unit frequency, min and max values.
Labels: this section allows customization of label related attributes such as orientation, color, unit frequency etc.
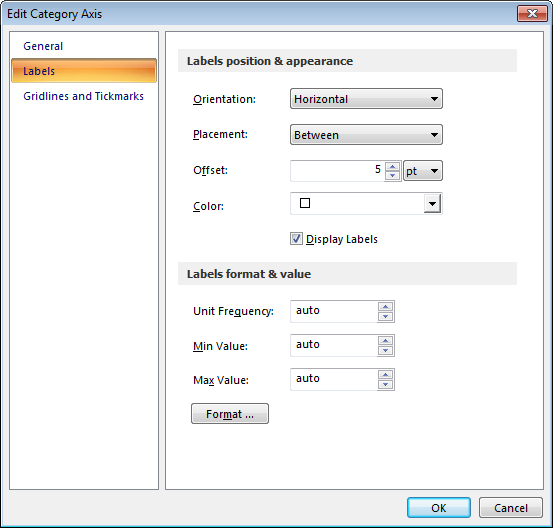
Gridlines and Tickmarks: style for tickmarks and colors for both gridlines and tickmarks can be customized in this section.