|
Editing Your Chart's Data Configuration |


|
To edit the data configuration of your chart, use the following information to assist.
1. In the Design Surface, select your chart to reveal the contextual Format Tab in the Ribbon.
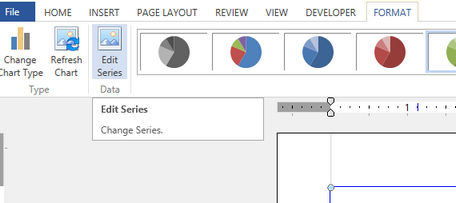
2. In the Format Tab, select the Edit Series button. This will launch the Edit Chart Dialog focusing just on the Series Group.

Figure 1: The Edit Series button allows you to edit your data configuration for the chart.
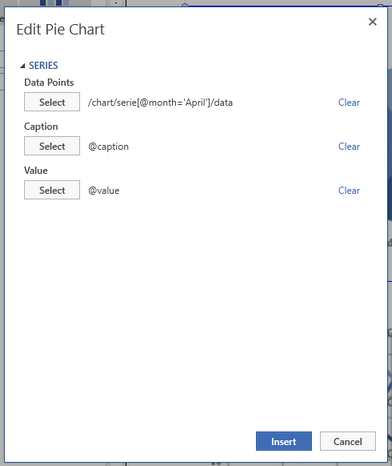
3. In this Dialog, you will be able to revisit your series configurations by using the Select buttons for data points, category, captions, and value configurations depending on the type of chart you are configuring.

Figure 2: The Edit Chart Dialog allows for quick configuration changes to the chart series.
4. When you have finished making adjustments to your chart series, you will need to select Insert to apply your changes to your chart.