|
Dashboard |


|
|
Dashboard |
|
A Dashboard is a useful collection of Widgets that provide a visualization of enterprise data with the purpose of analyzing key information. A Dashboard can consolidate data, portray trends through graphics, and allow viewers to use filtering options, all on a single screen. Although these dashboards are created by using the BI Architect, the widgets that provide these valuable analysis tools can be used in your templates.
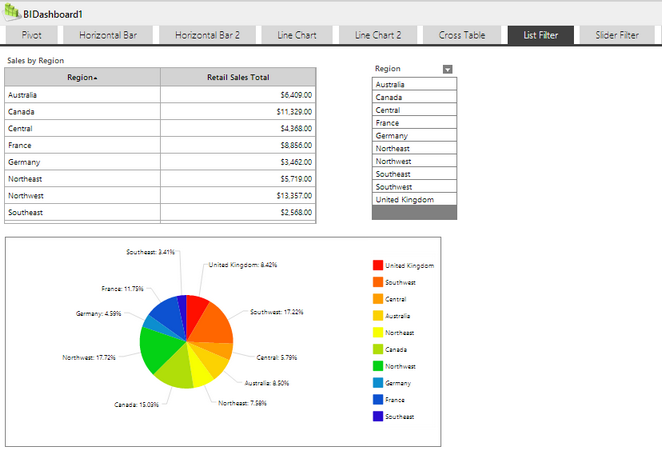
Figure 1: Sample dashboard with a pie chart, a table, and a list filter widgets.
Ecrion BI Dashboards come with the following standard features:
Out of the box, professional-grade reporting
Many times after working with a dashboard, users need to generate a PDF report that can be shared with other interested parties (colleagues, customers, etc.). All Ecrion BI Dashboards come with automated reports that don't require any configuration. But what is more, is that these reports are professional-grade. For example, they can be sent without any further changes to a mass-printing facility.
This is possible because the Ecrion BI platform includes the Ecrion document automation technology for which Ecrion is well known.
Amongst the supported output formats are PDF (including PDF/A for archiving or PDF/X for mass-printing), Word and PowerPoint and many image formats including JPEG and PNG.
Bookmarks & Collaboration
During many hours of analyzing the company data, users will sometimes need to get a snapshot of the state of the dashboard so that they can continue to work and still be sure that they can return to a previous state. Users can share a bookmark or the current view of a dashboard with other parties or by using the Email button that is integrated in every dashboard.
HTML 5
In Ecrion Publisher, all dashboards can be exported to HTML 5; this makes it very easy to integrate a dashboard in new or existing Web sites.