|
Inserting Widgets |


|
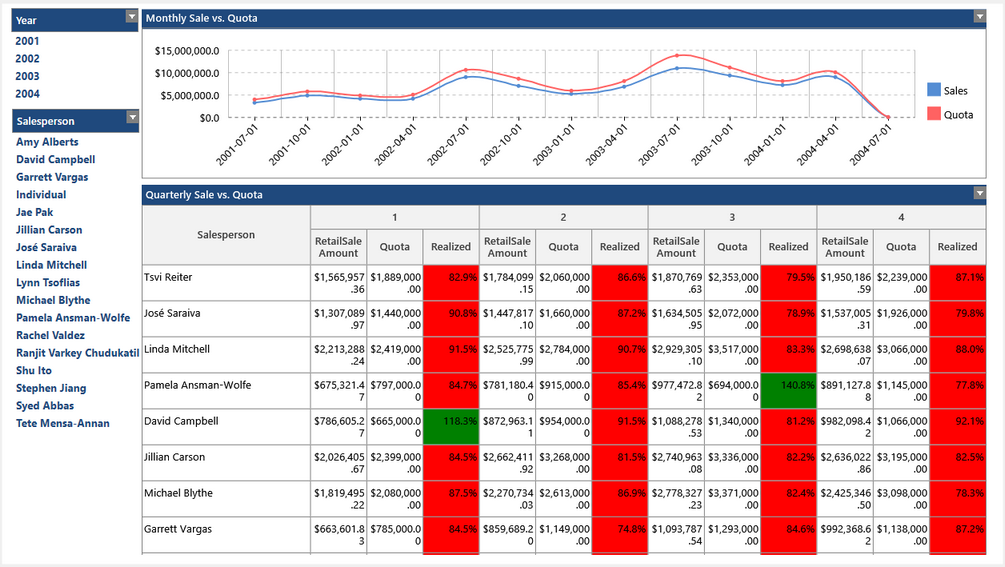
The interactive elements in your dashboard such as charts, tables, and filters, are called Widgets. Widgets are categorized as either Visualization Widgets or Filter Widgets. Once you have established a connection to your data, you can now proceed with inserting different Widgets to bring your data to life in your Dashboard. This section of the help documentation provides assistance with locating options to insert both types of widgets, and also general usage for your design.
Inserting Visualization Widgets - use tables, charts, gauges, and more to display your data.
Inserting Filter Widgets - provide your dashboard users with the capability to filter dashboard widget data.

Figure 1: A Dashboard displays visualization widgets and filter widgets.