|
How to Insert a Table |


|
1. Navigate to the Insert Tab in the Ribbon.
2. Locate the Visualization Group.
3. Select the Table button from the Visualization group.
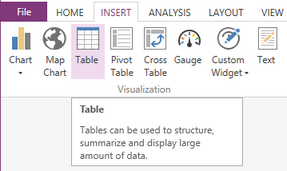
Figure 1: The Table button is highlighted in the Ribbon.
4. Select the Add new column button to create a new column in the Table.
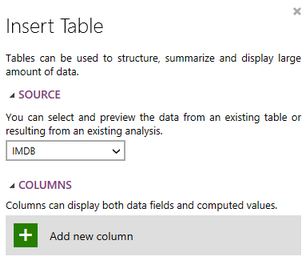
Figure 2: The new column button highlighted in the Insert Table dialog.
5. From the drop down list select the field you would like to populate this column.

Figure 2: The Date field was selected for one of the table columns.
6. If needed you can change the function of the column to any of the available options or add a custom function by selecting the summation button to the right of the Select Field dropdown.
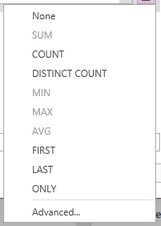
Figure 3: The list of available function types.
7. Select the Rename button to edit the column name. By default the column name will be the name of the field selected.

Figure 4: The column name was changed to Store.
8. Repeat the above steps (4-7) until you have added and configured all of the columns you need for your table.
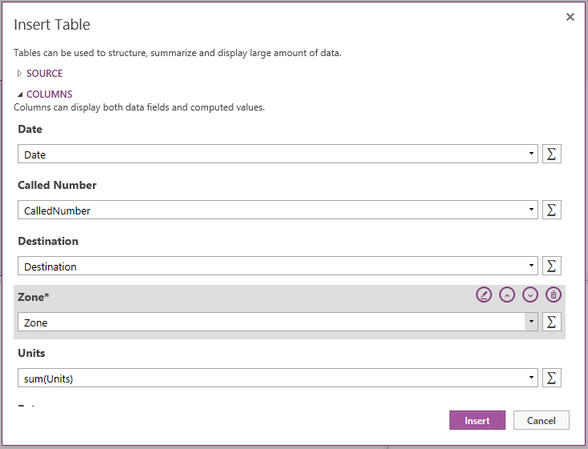
Figure 5: More columns have been added to the table.
10. Once you have configured all of your series all of your Table, you may need to apply a local filter to your data. Visit this helpful page to learn more about applying a local filter.

Figure 6: The edit filter button in the Insert Table Dialog.
11. You are able to enter a Caption for the Table in the Properties section if needed.
12. Once you have configured all the columns and filters select Insert and the Table will be inserted in to the design surface.
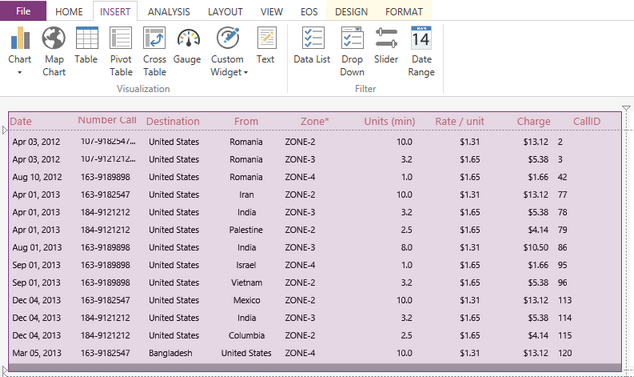
Figure 7: The resulting table in the design surface.
Next Steps
Table Properties - Learn about how to edit and customize your chart after inserting it into the design surface.
Include or Exclude Widgets - Learn how to exclude widgets from your dashboard without deleting it all together.
Resizing Widgets - Learn how to resize your widgets in the design surface.
Repositioning Widgets - Lean how to reposition your widgets after inserting into the design surface.