|
Arrow |


|
This widget is used to see the evolution of a dimension over a period of time, for example the number of customers between two years.
1. Navigate to the Insert tab in the ribbon.

Figure 1: The Insert tab in the ribbon.
2. Select the Custom Widget button from the Visualization group.
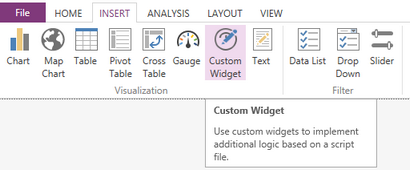
Figure 2: The Custom Widget button highlighted in the Insert tab.
3. In the Insert Custom Widget dialog select the browse button.
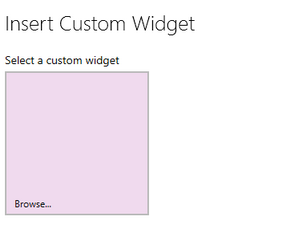
Figure 3: The browse button is highlighted.
4. Select the Arrow widget.
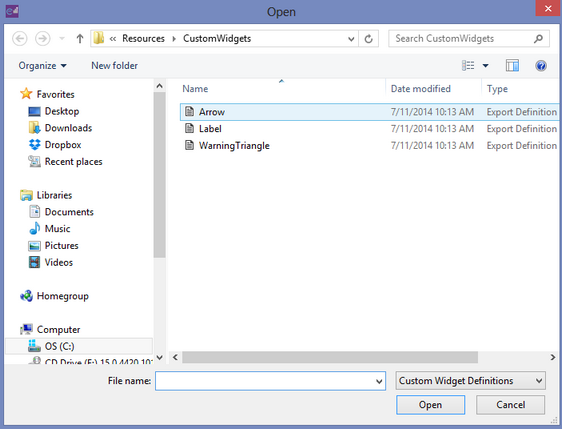
Figure 4: The arrow widget is highlighted.
5. Select the Reference Value field.
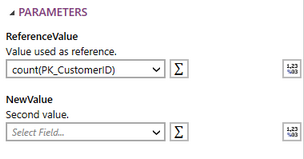
Figure 5: The count of the customer ID is selected.
6. If needed change the function of the Reference Value by selecting the summation button.
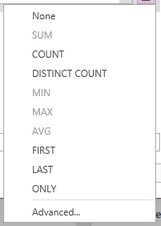
Figure 6: The list of available function types.
7. If needed you can select the format button and choose one of the formats available or create your own.
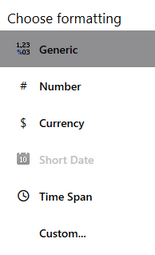
Figure 7: The list of formatting options.
8. Select the New Value field.
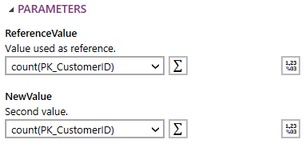
Figure 8: The count of the customers ID is used.
9. If needed change the function of the Reference Value by selecting the summation button.

Figure 9: The list of available function types.
10. If needed you can select the format button and choose one of the formats available or create your own.

Figure 10: The list of formatting options.
11. To define the limits of the analyzed period you will have to add Filters to the widget, one for the ReferenceValue and one for the NewValue. To learn more about adding a local filter visit Applying a Local Filter.
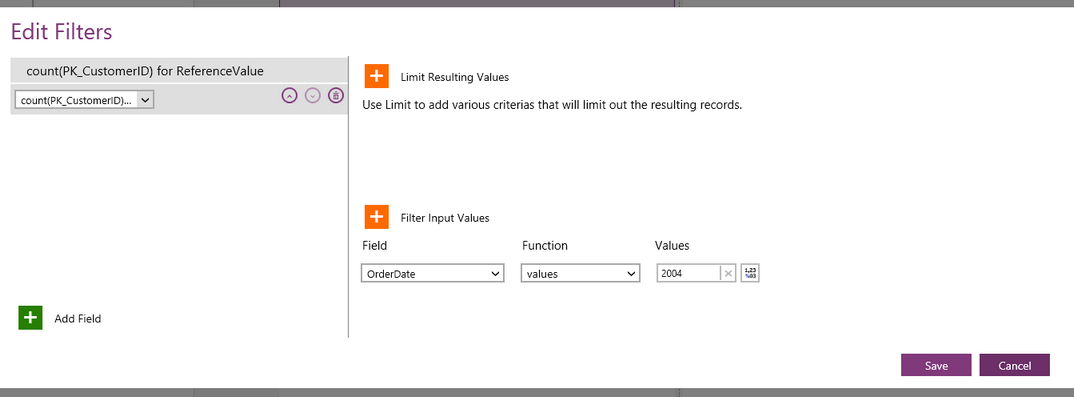
Figure 11: A filter has been added to both values.
12. When you have configured widget, select insert and it will be added to the design surface.
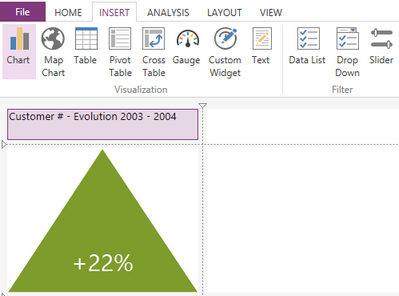
Figure 12: The resulting widget in the design surface.