|
Stacked Bar Chart |


|
|
Stacked Bar Chart |
|
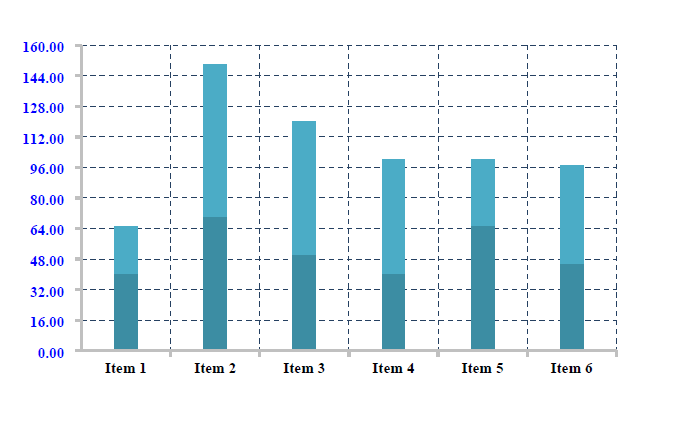
Example
2D version:
3D version:
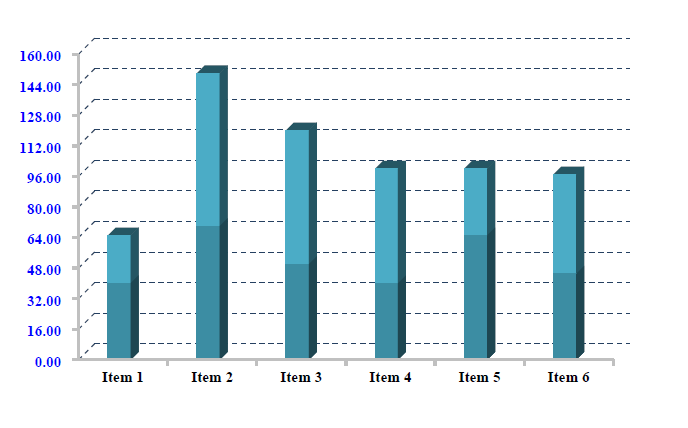
The code used to generate this chart is listed below. Adding the yellow highlighted attributes changes the aspect of the chart from 2D to 3D. Changing the green highlighted attribute to clustered changes the chart from stacked to clustered.
<xc:root width="600pt" height="500pt" xmlns:xc="http://www.ecrion.com/2008/xc">
<xc:plot-area x="50pt" y="50pt" width="350pt" height="200pt" aspect-3d-view="true" aspect-3d-chart-depth="7px">
<xc:bar-chart grouping="stacked" cluster-spacing="15px">
<xc:serie fill="#3C8DA3">
<xc:data-point width="20px" category="Item 1" value="40" />
<xc:data-point width="20px" category="Item 1" value="70" />
<xc:data-point width="20px" category="Item 6" value="50" />
<xc:data-point width="20px" category="Item 1" value="40" />
<xc:data-point width="20px" category="Item 1" value="65" />
<xc:data-point width="20px" category="Item 1" value="45" />
<xc:serie fill="#4BACC6">
<xc:data-point width="20px" category="Item 1" value="25" />
<xc:data-point width="20px" category="Item 1" value="80" />
<xc:data-point width="20px" category="Item 1" value="70" />
<xc:data-point width="20px" category="Item 2" value="60" />
<xc:data-point width="20px" category="Item 1" value="35" />
<xc:data-point width="20px" category="Item 6" value="52" />
</xc:serie>
</xc:bar-chart>
<xc:category-axis stroke="silver" stroke-width="2px" font-size="20pt" caption-color="red">
<xc:tick-marks tick-mark-style="outside" stroke-width="2px" stroke="silver"/>
<xc:grid-lines stroke="#254061" stroke-width="1px" stroke-dasharray="4px 4px"/>
<xc:display-values fill="black" offset="7px" placement="between" font-weight="bold"/>
</xc:category-axis>
<xc:value-axis stroke="silver" stroke-width="2px" font-size="20pt">
<xc:tick-marks tick-mark-style="outside" stroke-width="2px" stroke="silver"/>
<xc:grid-lines stroke="#254061" stroke-width="1px" stroke-dasharray="4px 4px" />
<xc:display-values fill="blue" offset="15px" font-weight="bold"/>
</xc:value-axis>
</xc:plot-area>
</xc:root>