|
Insert Chart Wizard |


|
|
Insert Chart Wizard |
|
Overview: XF Designer 2013 supports charts defined in the Ecrion XChart format. They can be embedded in XSL-FO via the fo:instream-foreign-object element.
Charts can be created using dynamic data from XML using an XFD template and the Insert Chart Wizard. That means that the user must first assign a data source to the document.
Accessing: To insert a chart, the Chart button located in the Graphics group under the Insert tab must be selected.
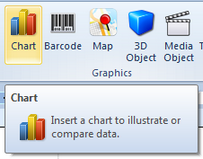
The Insert Chart Wizard will be displayed:
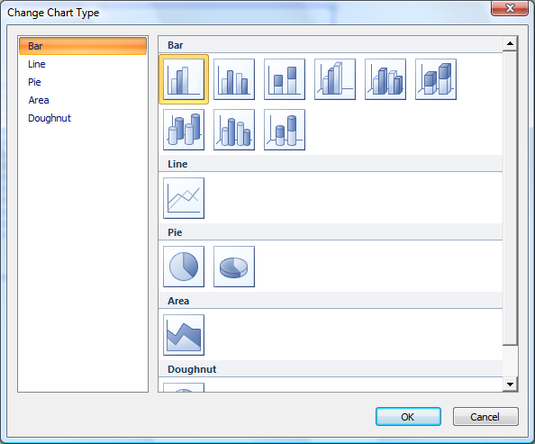
After the Chart Type is selected, the OK button must be pressed to continue.
The sample below will show the steps that must be followed in order to insert a 3D bar chart.
The following source XML will be used:
<?xml version="1.0" encoding="utf-8"?>
<root>
<bar>
<serie>
<data value="24.5" caption="Value 1" width="20px" color="red"/>
<data value="15.5" caption="Value 2" width="20px" color="green"/>
<data value="25" caption="Value 3" width="20px" color="purple"/>
<data value="35" caption="Value 4" width="20px" color="orange"/>
</serie>
</bar>
</root>
The next step allows defining one or more data series for the selected chart:
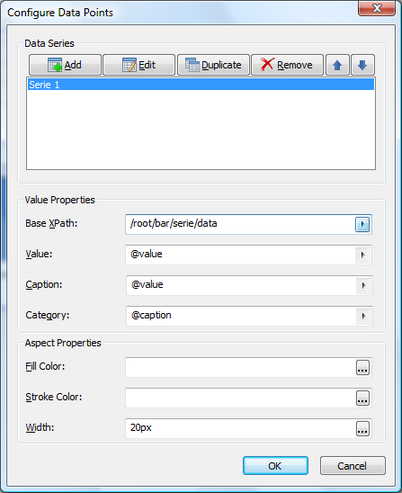
Charts are created using repeating (dynamic) elements from the source XML file.
| • | Base XPath - represents the repeating element that will be the base for the current serie |
| • | Value - specifies the dynamic values for Value Axis |
| • | Caption - specifies the chart's caption labels |
| • | Category - specifies the chart's values for Category Axis |
| • | Fill color - specifies the chart's fill color |
| • | Stroke color -specifies the chart's stroke color |
| • | Width - specifies the chart's width |
Value, Category, Fill Color, Width and Description can be defined as either static values or XPaths relative to the base XPath.
In this example, the first two fields are dynamic, while the rest are static.
Note: In this example, a 3D bar chart has been selected. For other charts, the fields in the value and aspect properties may differ, but the behavior is the same.
To add the chart to the document, the OK button must be selected.
The end result must look like the following:
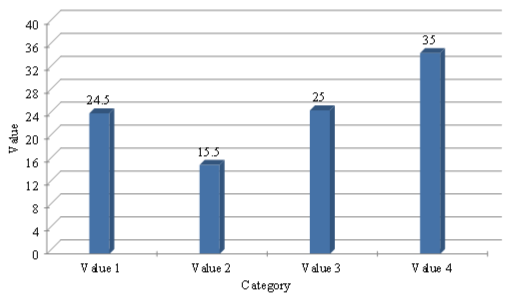
In order to edit the chart, the user must double-click on it in Design View and the previous wizard will appear, allowing changes to the already inserted object.