|
Area Chart |


|
|
Area Chart |
|
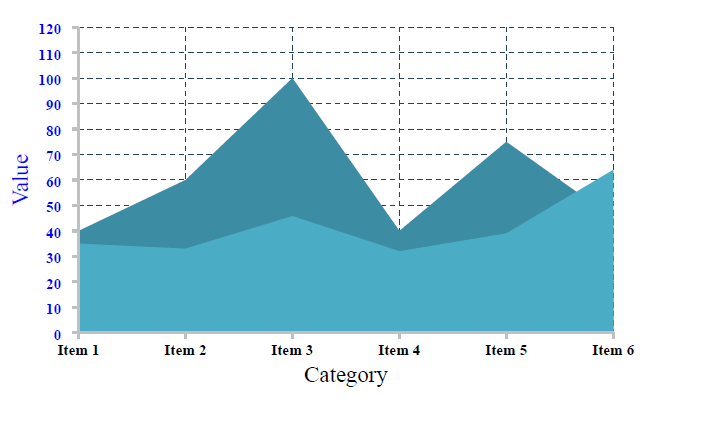
Example
2D version:
3D version:
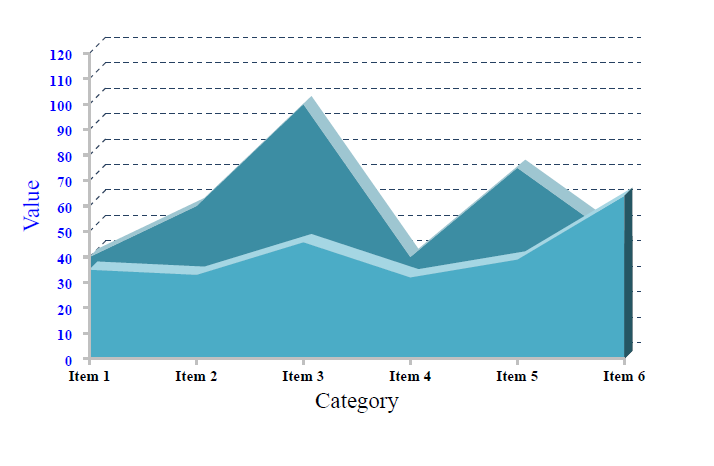
The code used to generate this chart is listed below. Adding the highlighted attributes changes the aspect of the chart from 2D to 3D.
<xc:root width="600pt" height="500pt" xmlns:xc="http://www.ecrion.com/2008/xc">
<xc:plot-area x="50pt" y="50pt" width="350pt" height="200pt" aspect-3d-view="true" aspect-3d-chart-depth="7px">
<xc:area-chart>
<xc:serie fill="#3C8DA3" stroke-width="2pt">
<xc:data-point width="20px" category="Item 1" value="40" />
<xc:data-point width="20px" category="Item 2" value="60" />
<xc:data-point width="20px" category="Item 3" value="100" />
<xc:data-point width="20px" category="Item 4" value="40" />
<xc:data-point width="20px" category="Item 5" value="75" />
<xc:data-point width="20px" category="Item 6" value="45" />
</xc:serie>
<xc:serie fill="#4BACC6" stroke-width="2pt">
<xc:data-point width="20px" category="Item 1" value="35" />
<xc:data-point width="20px" category="Item 2" value="33" />
<xc:data-point width="20px" category="Item 3" value="45.8" />
<xc:data-point width="20px" category="Item 4" value="32" />
<xc:data-point width="20px" category="Item 5" value="39" />
<xc:data-point width="20px" category="Item 6" value="64" />
</xc:serie>
</xc:area-chart>
<xc:category-axis stroke="silver" stroke-width="2px" font-size="15pt" caption="Category" caption-offset="5pt">
<xc:tick-marks tick-mark-style="outside" stroke-width="2px" stroke="silver"/>
<xc:grid-lines stroke="#254061" stroke-width="1px" stroke-dasharray="4px 4px"/>
<xc:display-values fill="black" offset="7px" font-weight="bold"/>
</xc:category-axis>
<xc:value-axis stroke="silver" stroke-width="2px" font-size="15pt" caption="Value" caption-color="blue" caption-offset="7pt">
<xc:tick-marks tick-mark-style="outside" stroke-width="2px" stroke="silver"/>
<xc:grid-lines stroke="#254061" stroke-width="1px" stroke-dasharray="4px 4px" />
<xc:display-values fill="blue" offset="15px" font-weight="bold"/>
</xc:value-axis>
</xc:plot-area>
</xc:root>