|
Widget |


|
|
Widget |
|
Widgets are user interface elements which are used to present data within and interact with a Dashboard. Widgets are designed in the BI Architect to be included in your dashboards and ultimately can be used in your reports. If you have designed dashboards using this application, you can include those widgets into your designed report templates in the BI Publisher.
Here are a few examples of commonly used Widgets:
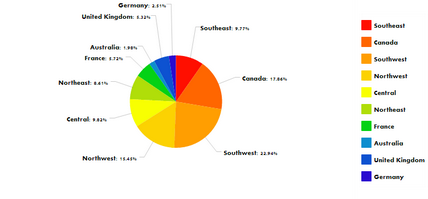
Figure 1: A pie chart widget used to show regional sales |
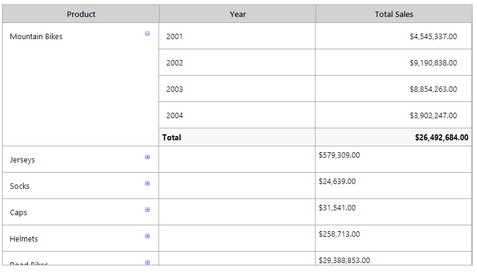
Figure 2: A Pivot Table widget used to display sales data by product and year