|
Sort |


|
A Sort Command be a useful addition to your Data Diagram when you are looking to sort your included output data based upon a specified sort rule. Such design can be important when designing data sources to be used by reports needing the data to be sorted without needing to sort the data through the report template. In this section, you can find helpful information on inserting and configuring a Sort Command in your Data Diagram to meet your sorting needs.
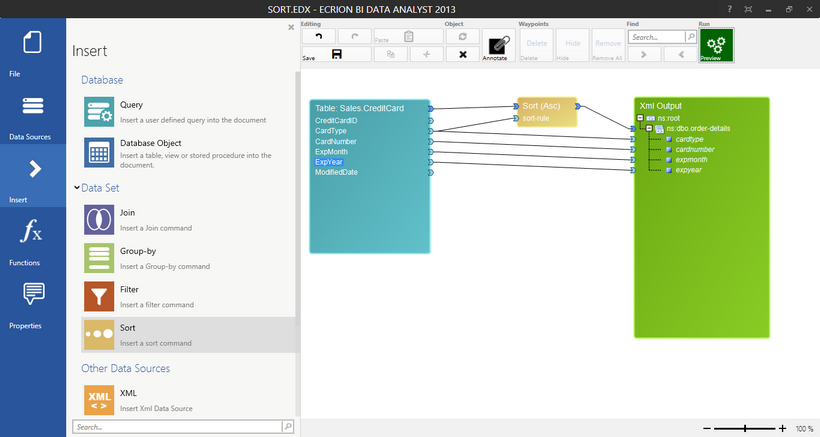
Figure 1: A Sort Command is used to Sort the output data set.
When to Use a Sort Command
An example of using a Sort Command in a Data Diagram would be if a particular data source held transactional data for all credit card purchases. If a report needs to be generated that uses these transactional data points to be displayed in order by date in a monthly statement, the data can be provided to the report template to sorted. For this example, a Sort Command can be used sort the entire data set by a present date field in the data source, and then simply include all of the necessary data points in the output.
Usage
To successfully set up a Sort Command in your Data Diagram, you will need to follow the steps listed below. Below you can find an example scenario that we will use to help demonstrate this configuration process.
Scenario: A report needs to be generated each month for archiving processed credit card transactions. This report must reflect all credit card information on hand but must be sorted so that all credit card types are listed together.
Insert Your Data Source Object
The first step you must take is to insert your data source object. By selecting Insert in the Side Menu you can select from Database Objects, Queries, and Other Data Sources. For this example, we will use the table that holds our sample credit card data for sale orders.
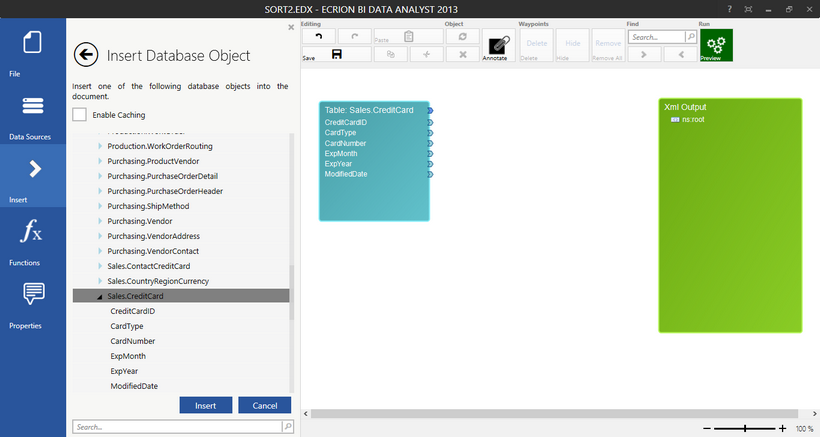
Figure 2: A Database Table is inserted into the Data Diagram to be used to sort.
Insert a Sort Command
Next, you will need to select Insert from the Side Menu and find the Sort Command option located in the Data Set Objects group. By selecting this option, you will notice that the Sort Command Object is inserted into Design Surface. It is recommended that this object be placed between the input source and output data source. This will ensure easy data mapping in future steps. You should notice that the Source Command contains a blue data set arrow for connecting your data source as well as an arrow for your input sort-rule. The sort rule will be the item that the sort function will use to sort your data. 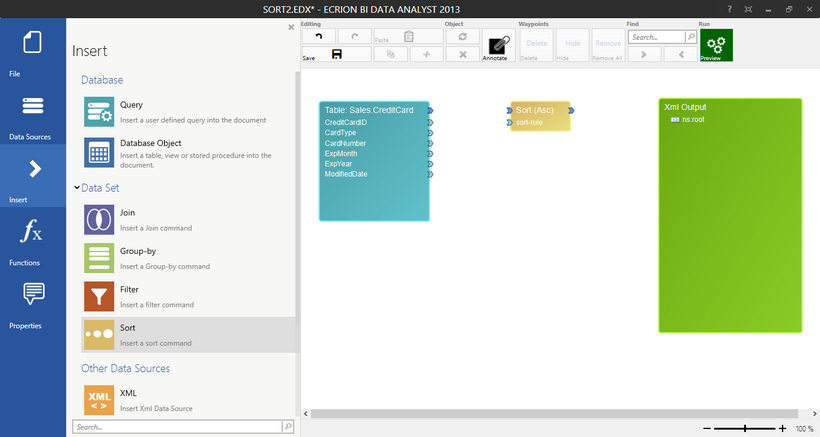
Figure 3: A Sort Command is inserted into the Data Diagram.
Use Data Connections to Map Your Data Flow
Now that you've added the appropriate Diagram Objects into the Data Diagram, you will need to use Data Connections to map the flow of your data. In this step you will need to use the connection arrows to map the data appropriately. Below is a list of the steps required to complete the setup of the Data Diagram to meet the needs of this example.
| • | Connect the input Database Table source blue arrow to the Sort Command input source blue arrow. |
| • | Connect the Sort Function output blue arrow to the output source ns:root to create an element sequence. |
| • | Connect the CardType field to the sort-rule input parameter in the Sort Command. |
| • | Connect the CardType, CardNumber, and ExpMonth fields to the created element sequence to create attributes. |
The result of these Data Connection connections will be a completed data mapping as indicated in Figure 4.
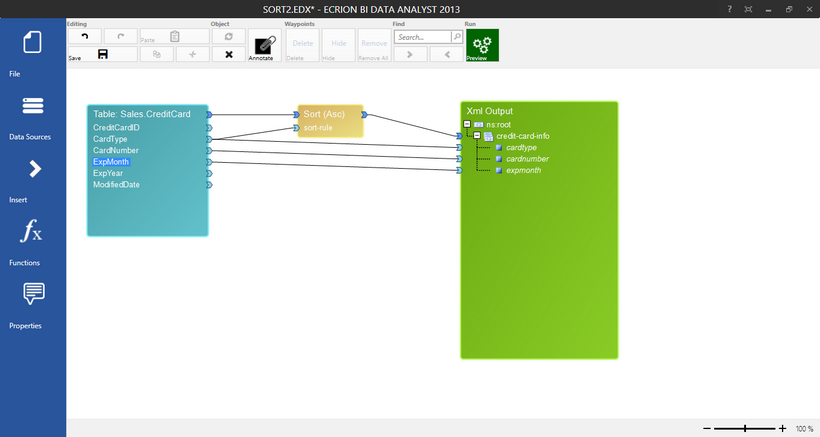
Figure 4: Data Connections are used to complete the data mapping.
Results
It is recommended that once your setup is complete, you use the Preview option available to you in the Toolbar. Here you can see the results of your Sort Command to ensure that your Data Diagram is properly designed. As indicated in Figure 5, the credit card sales transactions are sorted by card type.
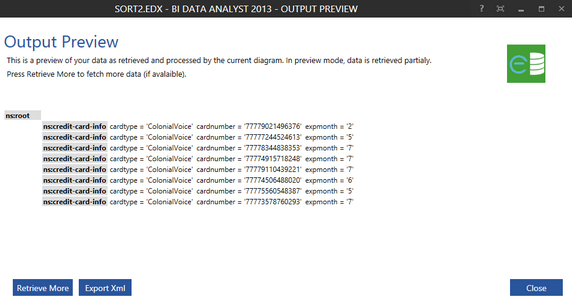
Figure 5: The Output Preview Screen reveals the output is sorted by card type.