|
Data Diagram |


|
|
Data Diagram |
|
Whether you are designing a data source to drive a Dashboard created in the BI Data Architect, a data source to be used with your Document Template for document production, or even designing the creation of a new table through a data transformation and ingestion output, you will be designing what we will be calling a Data Diagram.
A Data Diagram uses the combination of multiple Data Sources, connecting Data Connections, available Functions, and a desired output object to obtain data, perform operations on, and produce a well structured data source for your usage. This Data Diagram will visually represent the source of each data point in your output data object and also show any transformation performed on the data through using Functions.
This Data Diagram will be used by Ecrion's Data Aggregation Server to target each data source, obtain data, and transform and aggregate as specified.
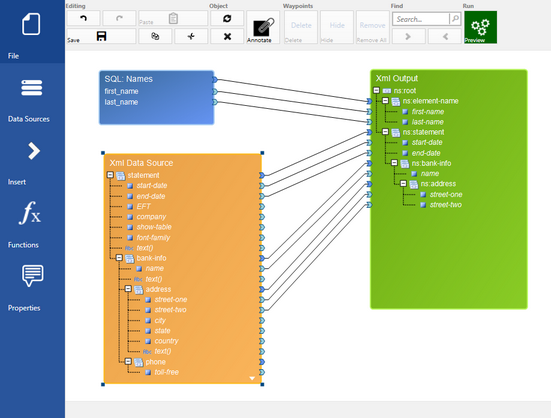
Figure 1: A completed Data Diagram obtains data from two different Data Sources.